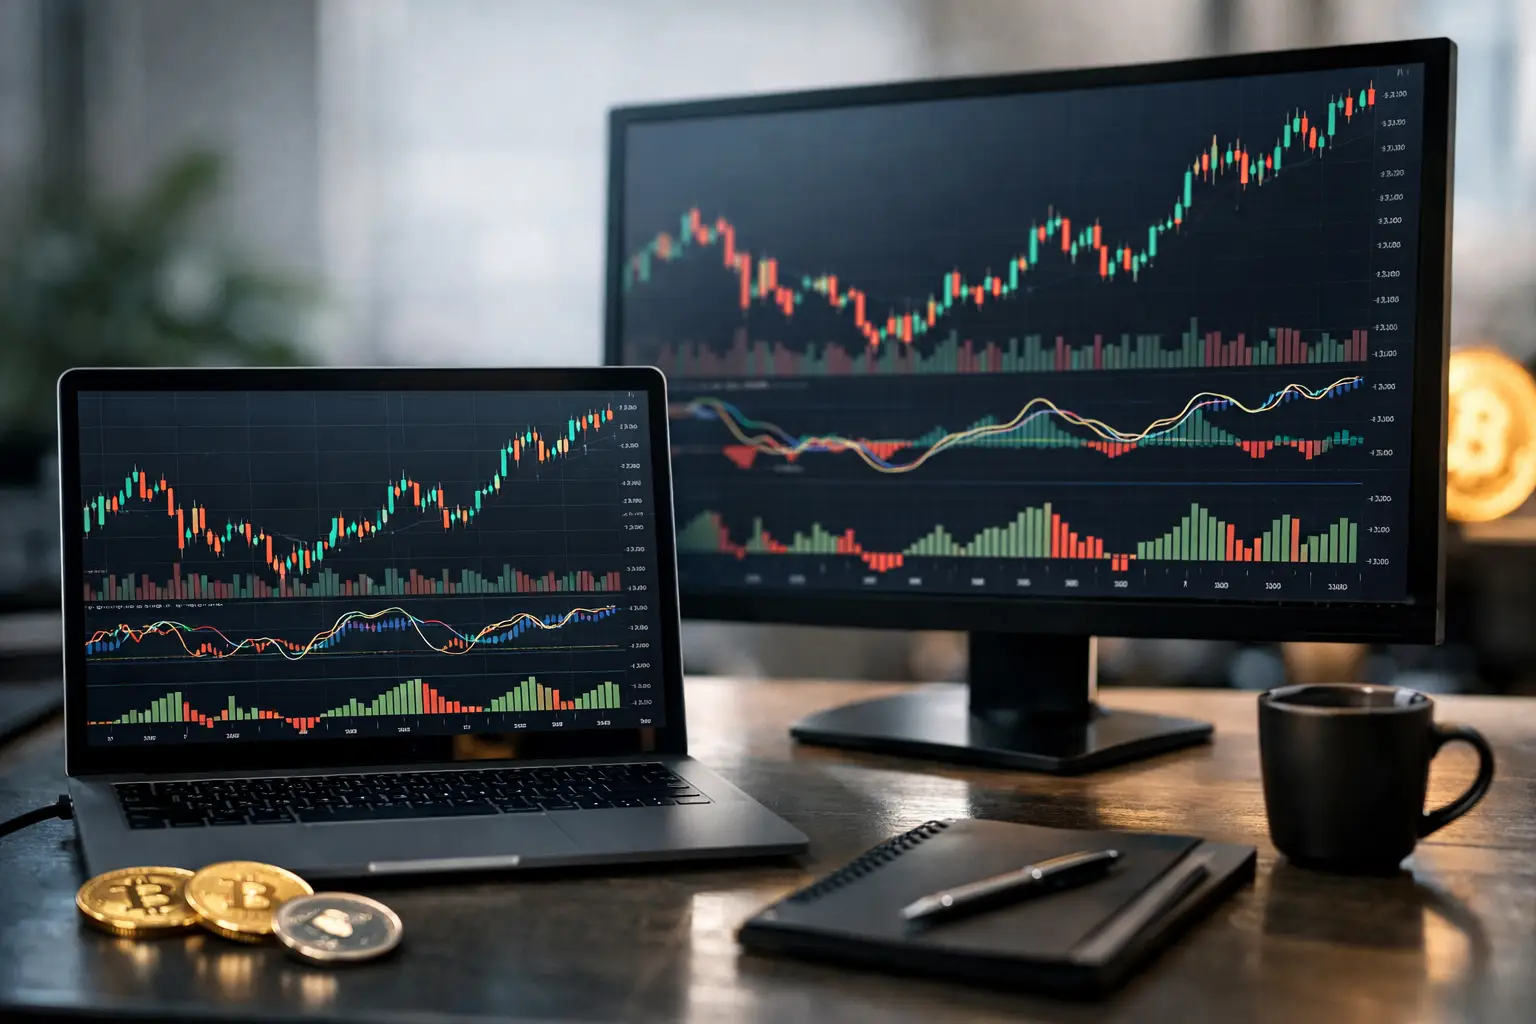
When a crypto chart starts to accelerate, the real problem is not finding an indicator. It’s knowing which one to listen to without piling up ten contradictory signals. The best TradingView crypto indicators are not used to predict the market. They are used to read it better, to filter the noise and to make more coherent decisions according to your horizon, your level and your method.
On TradingView, the offer is immense. This is a strength, but also a classic trap for beginners. Many add RSI, MACD, Bollinger Bands, volume, moving averages and a few community scripts, then end up with a busy and unusable screen. Useful analysis is often based on three simple building blocks: trend, momentum and volume confirmation.
The good starting point is therefore to choose a few complementary, not redundant, indicators. Here are the ones that come up most often in serious analyzes of the crypto market, with their strengths, their limitations and the context in which they really make sense.
What are the best TradingView crypto indicators?
There is no universal classification valid for all profiles. A daily swing investor on Bitcoin does not have the same needs as an intraday trader on altcoins. That said, some tools remain particularly useful because they answer simple questions: is the trend bullish or bearish? Does the movement still have strength? Is the market in excess? Does the volume confirm the price?
1. Moving averages, to frame the trend
If you had to start with just one tool, moving averages would be a logical choice. They smooth the price and allow you to quickly see if the market is moving above or below its average momentum. In crypto, the combinations 20, 50, 100 and 200 periods are the most used.
The exponential moving average, or EMA, reacts to price faster than the SMA. It is well suited to volatile markets like Bitcoin or Ether. A 20 EMA can help follow a short trend, while a 200 EMA provides a background framework. When the price remains above its long averages for a long time, the context is generally more constructive. When he loses them again, caution becomes a priority again.
The limit is simple: moving averages delay movement. They describe more than they anticipate. In a flat market, they also generate a lot of false signals. They are therefore very effective for filtering a trend, less so for finding a precise entry point on their own.
2. The RSI, to measure excess and rhythm
The Relative Strength Index is probably the most popular indicator among retail traders. It measures the speed and amplitude of recent price changes. The classic reading is based on overbought areas above 70 and oversold areas below 30.
On crypto, it must be used with nuance. In a strong uptrend, an RSI above 70 does not necessarily mean that you should sell. It often indicates that momentum is strong. Likewise, a low RSI in a bear market may stay low longer than expected. The real interest of the RSI is often elsewhere: spotting divergences, comparing the strength of several assets and checking whether a decline occurs with loss or maintenance of momentum.
For a beginner, the RSI works better as a context indicator than as a buy or sell button. It gains a lot in quality when combined with a clear technical level or an already identified trend.
3. The MACD, to read changes in dynamics
The MACD is popular because it makes momentum transitions visible. It compares two moving averages and displays both a MACD line, a signal line and a histogram. On TradingView, it is simple to configure and remains very relevant on intermediate time units such as 4 hours or daily.
When the MACD line crosses above the signal line, it can signal renewed momentum. The opposite can mark shortness of breath. The histogram helps to see if the gap between the two is increasing or reducing. On crypto, this visual aspect is useful because reversals can be rapid.
Like moving averages, the MACD is a lagging indicator. He can intervene too late on sudden movements. Its main interest is to confirm an already emerging transition, not to detect a perfect low point.
4. Volume, often more useful than a complex indicator
Many traders underestimate volume even though it answers a key question: is the move supported by real market participation? A breakout of resistance without volume is less valuable than a breakout accompanied by a sharp increase in trading.
On TradingView, volume bars are already a very good basis. You can also use Volume Profile or OBV if you want to go further. For a beginner investor, observing the relationship between price and volume is already enough to avoid some false signals. An asset that is rising with falling volume may show shaky movement. Conversely, a volume-backed rally deserves more attention.
The volume isn’t magic either. On some illiquid altcoins, the data can be misleading. We must therefore take into account the quality of the observed market and avoid interpreting an isolated peak without context.
5. Bollinger bands, to understand volatility
Bollinger bands surround a moving average with two bands calculated according to standard deviation. In practice, they are used to visualize the compression and expansion phases of volatility. On crypto, where calm periods sometimes lead to very violent movements, this is an interesting tool.
When bands tighten, the market often prepares for a larger move. When the price touches or exceeds a band, this does not automatically mean that you should take the opposite approach. In a strong trend, the price may stay stuck at the upper or lower band for a while.
The proper use of Bollinger bands consists above all in reading the market regime. If it is calm, compressed, or accelerating. They are very useful for adjusting your expectations, but less reliable if you use them alone to buy each low band contact or sell each high band contact.
6. VWAP, relevant for the short term
VWAP, or Volume Weighted Average Price, is used more by short-term traders, but it deserves to be known. It calculates a volume-weighted average price. This allows you to see if the market is trading above or below an average level deemed significant for the session.
Intraday, a price above the VWAP often reflects better buying behavior. Below, the bias is more fragile. On crypto, where the market operates 24 hours a day, the VWAP must be interpreted with a little more perspective than on stocks, but it remains useful for structuring a trading day.
For a medium-term investor, this is not the priority indicator. For an active trader, on the other hand, it can be one of the best TradingView crypto indicators if the objective is to better manage execution timing.
7. The Supertrend, simpleand visual
The Supertrend is very popular with beginners because it is readable. It directly displays a bullish or bearish bias on the chart, depending on volatility and price. When the line crosses below the price, the signal is generally bullish. When it goes above, the signal becomes bearish.
Its main advantage is clarity. It helps to stay disciplined and avoid fighting against an obvious tendency. Its main fault is also its simplicity: in a market without direction, it can alternate signals too often. So it is best to combine it with a long moving average or volume filter.
How to choose the best TradingView crypto indicators according to your profile
If you are starting out, the most effective thing is to build a simple system. A moving average for the trend, the RSI for momentum and volume for confirmation are more than enough to progress. This trio covers the essentials without overwhelming the reading.
If you are swing trading, you can add the MACD or Bollinger Bands to better read transitions and volatility. If you are trading very short term, VWAP and Supertrend become more relevant, provided you accept more frequent signals and stricter discipline.
The key point is to avoid duplicates. An EMA, MACD, and Supertrend sometimes tell a similar story, as they all drift from price with some lag. Multiplying similar tools often gives an illusion of precision, not better analysis.
What many do wrong on TradingView
The most common mistake is looking for the perfect indicator. It doesn’t exist. An indicator is a transformation of price, sometimes volume. It simplifies information, but it does not replace market structure, key levels or risk management.
Another classic mistake: changing settings after each loss. This behavior leads to optimizing the past instead of constructing a stable method. It is better to choose a few consistent settings, test them on several assets and several periods, then judge their usefulness with hindsight.
Finally, many confuse signal and decision. A bullish crossover is not an automatic buy order. We must always ask ourselves: where is the underlying trend, where is the level of invalidation, and does the risk-return ratio remain acceptable? It is this framework that makes the difference between analysis and impulse.
At Yapuka Investir, this logic is central: using technology and data to clarify the decision, not to blindly delegate it to an indicator.
A good chart doesn’t need ten tools. It needs a disciplined reader who can understand what the market is showing, what it is not yet showing, and when it is better to wait rather than act.