Indicators
Ya.puka Indicators
Find the levels, readings and explanations of the indicators followed in Ya.puka Trader, Ya.puka Holder and Ya.puka Invest.
Search for an indicator or course
Indicator
💎 Ya.puka Exclusive
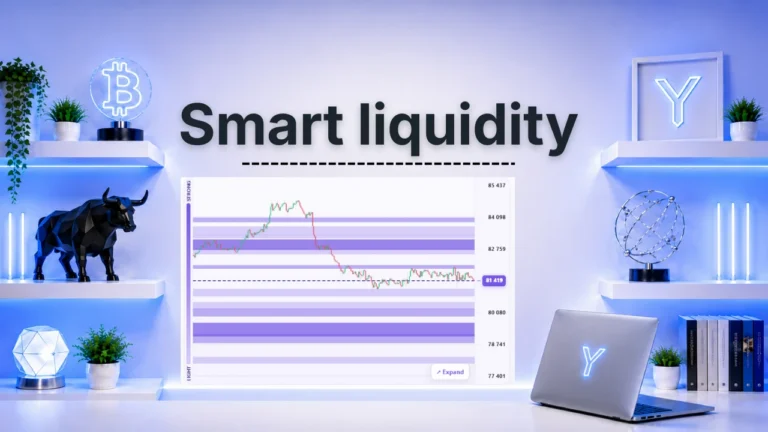
Smart Liquidity
Discover Smart Liquidity, a Ya.puka Trader indicator to spot the levels where price reacts, with the…
Indicator
💎 Ya.puka Exclusive
Sweet Spot
Discover the Sweet Spot, a Ya.puka Trader indicator to measure the usual duration of a BTC…

Indicator
CVD
Discover the CVD, a Ya.puka Trader indicator to read real buying and selling pressure in crypto…

Indicator
Dominance Bitcoin
Discover Bitcoin dominance, what it indicates about the weight of BTC and its impact on altcoins…

Indicator
DXY
Learn about DXY, the US Dollar Index, and why it often influences Bitcoin, cryptos and risky…

Indicator
ETF Bitcoin
Discover ETF Bitcoin, their role in institutional flows and their possible impact on Bitcoin and the…

Indicator
Funding
Discover the Funding, a crypto indicator that helps read the cost of leverage, euphoria or fear…

Indicator
Liquidations
Learn about crypto liquidations, how they relate to leverage, and their role in rapid market movements.
Indicator
💎 Ya.puka Exclusive
Options
Discover crypto options with Ya.puka Trader: a five-marker summary, GEX and DEX cards, hedging zones and…

Indicator
Stablecoins
Learn about stablecoins, their role in crypto liquidity, and what they can indicate about risk appetite.

Indicator
US Rates
Find out why US bonds and interest rates influence Bitcoin, crypto and risky markets.

Indicator
Long/Short Ratio
Discover Long/Short Ratio, a Ya.puka Trader indicator designed to help analyze markets and make more structured…

Indicator
Money Flow
Discover Money Flow, a Ya.puka Trader indicator designed to help analyze markets and make more structured…

Indicator
Open Interest
Discover Open Interest, a Ya.puka Trader indicator designed to help analyze markets and make more structured…
 DebriefLesson 1 / 20
📈 Trading
Debrief
Introduction to the trading course: understand the technical logic of the market, applicable to all assets…
TradingViewLesson 2 / 20
📈 Trading
TradingView: basic setup
Discover TradingView, understand the recommended plan, add indicators and use alerts to monitor important zones.
CandlesLesson 3 / 20
📈 Trading
Understanding Japanese candlesticks
Learn how to read a Japanese candlestick: open, close, body, wicks, high and low.
TimeframesLesson 4 / 20
📈 Trading
Understanding timeframes
Understand timeframes, choose a timeframe and adapt your analysis to day trading or swing trading.
StructureLesson 5 / 20
📈 Trading
Market Structure
Learn how to recognize an uptrend, a downtrend, a range and a change in market structure.
RangesLesson 6 / 20
📈 Trading
Ranges
Understand range phases, their upper and lower zones, and why the middle is often dangerous.
S/RLesson 7 / 20Members only
📈 Trading
Supports and resistances
Learn how to identify support and resistance zones, think in zones and avoid overly precise lines.
Premium / DiscountLesson 8 / 20Members only
📈 Trading
Premium and discount zones
Understand premium and discount zones to avoid buying too high or selling too low.
FibonacciLesson 9 / 20Members only
📈 Trading
Fibonacci: retracements
Understand Fibonacci retracements, the important levels and the golden zone.
Fibo Ext.Lesson 10 / 20Members only
Course
Fibonacci: extensions
Use Fibonacci extensions to identify potential targets after an impulse.
TrendlinesLesson 11 / 20Members only
Course
Trendlines
Learn to draw a trendline cleanly and understand what it really shows.
Moving avg.Lesson 12 / 20Members only
Course
Simple moving averages: 20, 50, 100 and 200
Understand the 20, 50, 100 and 200 moving averages and their role in reading the trend.
VegasLesson 13 / 20Members only
Course
Vegas
Understand the Vegas as dynamic zones of trend, support or resistance.
LiquidityLesson 14 / 20Members only
Course
Liquidity zones
Understand where stops are often located and why price may go and look for these zones.
FVG / IFVGLesson 15 / 20Members only
Course
FVG / IFVG, tested and untested
Understand FVGs, IFVGs, and the difference between a tested and an untested zone.
ConfluenceLesson 16 / 20Members only
Course
Confluence
Understand why it is better to combine several elements rather than make a decision on a…
Money FlowLesson 17 / 20Members only
Course
Money Flow
Add Money Flow to technical analysis to understand whether the context supports the move.
Patterns bougiesLesson 18 / 20Members only
📈 Trading
Most common candlestick patterns
Discover the most common candlestick patterns and understand that they must always be read in context.
ChartismeLesson 19 / 20Members only
📈 Trading
Most common chart patterns
Know the main chart patterns without using them as automatic signals.
ExampleLesson 20 / 20Members only
Course
Complete example
Put together all the concepts seen in the course to build a simple and logical reading…
No content matches this search.