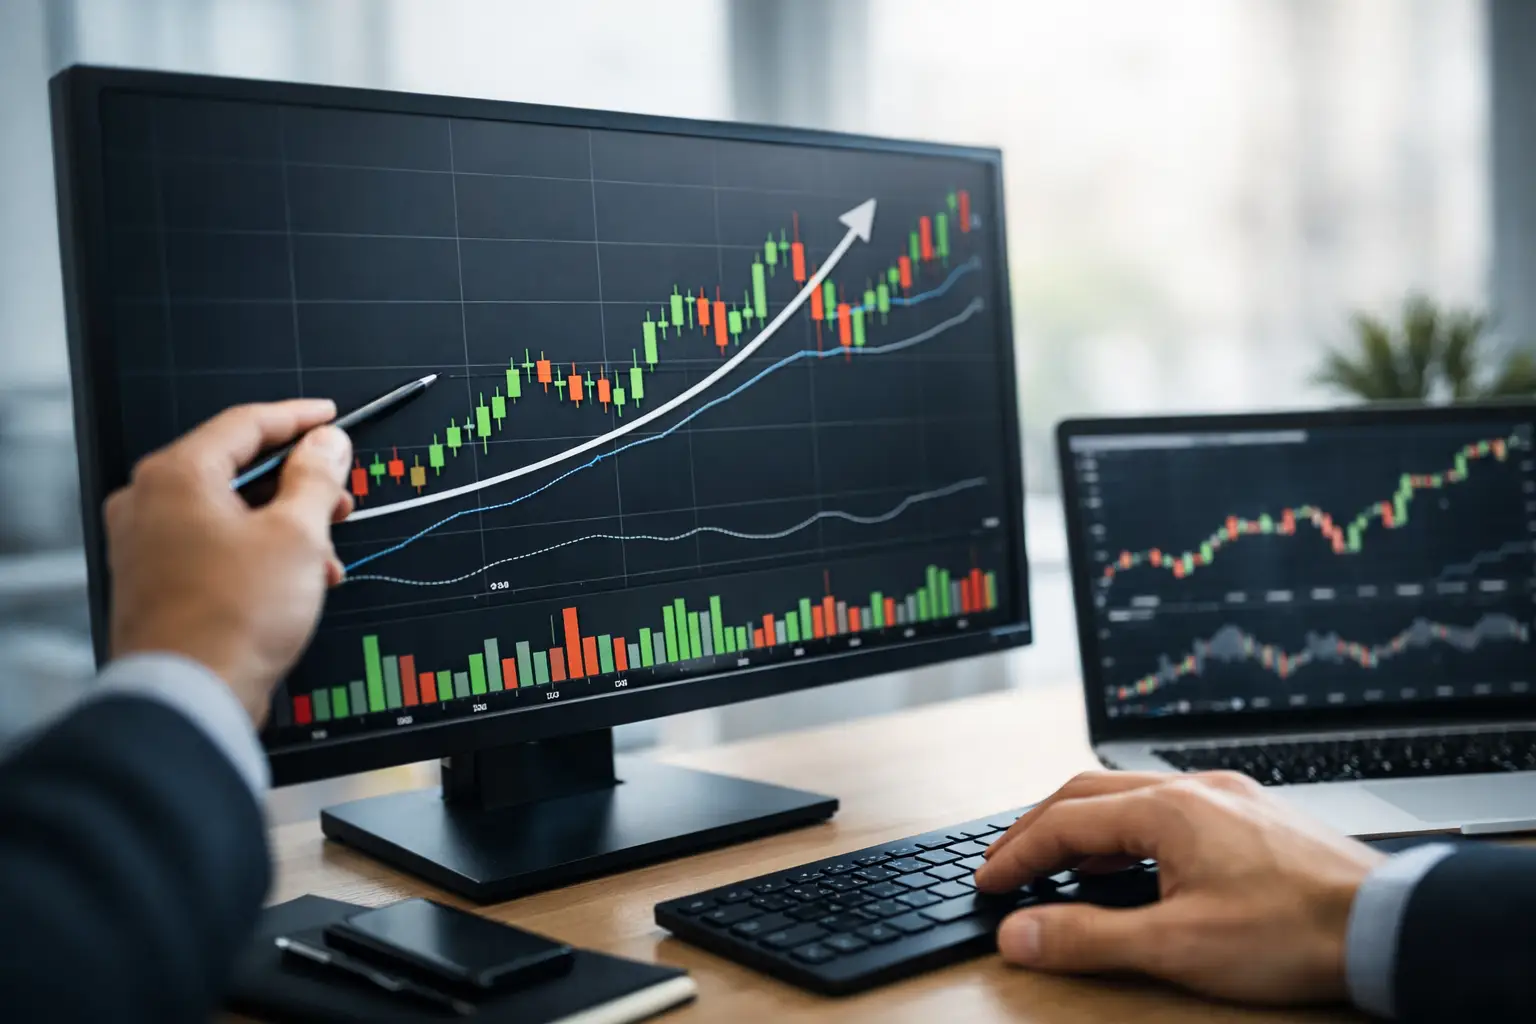
A market that rises for three days is not necessarily in trend. This is often where newbie investors go wrong. To understand how to identify a trend, you must learn to distinguish a real fundamental movement from a simple rebound, a phase of hesitation or a temporary excess of enthusiasm.
In investing, a trend is not an intuition. It is an observable direction in price, often confirmed by time, volumes and market context. The more you adopt a structured reading, the less risk you have of confusing useful signal and short-term noise.
How to identify a trend without overinterpreting the market
The first rule is simple: a trend can be read over time. On a graph, it corresponds to a coherent succession of movements. An uptrend generally forms increasingly higher highs and lows. A downtrend shows the opposite. When neither one nor the other prevails, the market often moves in a range, that is to say without clear direction.
The problem is that many investors look at a single unit of time and jump to conclusions too quickly. A stock may appear strong over a few hours, but remain bearish over several weeks. Conversely, an asset can correct over two sessions while remaining solidly bullish over several months. Identifying a trend therefore requires placing the movement within several time horizons.
This is particularly true in crypto, where rapid variations easily create the illusion of a reversal. A price spike is not proof. A credible trend relies on the repetition of consistent signals, not a spectacular candle.
The three elements to observe as a priority
Before releasing complex indicators, we need to go back to basics. The price remains the most important information. It is he who synthesizes, at a given moment, the anticipations of buyers and sellers.
The first element to observe is therefore the price structure. If the lows gradually rise and the highs are exceeded, the dynamic is constructive. If the rebounds become weaker and weaker and the supports break regularly, the selling pressure dominates. This reading seems simple, but it is already very powerful.
The second element is volume. An upward movement supported by increasing volumes is generally more reliable than a sluggish rise with little trading. Volume doesn’t tell the whole story, but it helps measure market conviction. When a breakout occurs without participation, caution is often warranted.
The third element is time. A real trend takes time to build. The more a movement persists despite intermediate corrections, the more credibility it gains. Conversely, a sudden surge in an illiquid asset can disappear as quickly as it appeared.
Time units completely change the analysis
One of the most common mistakes is trying to answer an overall question with a single graph. However, a trend always depends on the observed framework. An intraday trader, a long-term investor and a crypto holder over several months are not necessarily talking about the same thing when they say that a market is bullish.
A simple method is to start from the long term and go down gradually. First look at the main trend on the weekly or daily chart. Then, use a shorter unit to refine your entry point or better understand the current phase. This avoids buying against the dominant dynamic simply because a smallrebound looks attractive.
This multi-timeframe approach also helps to put emotional movements into perspective. A decline of 4% may seem brutal over a few hours, but remain insignificant in an underlying upward trend. Without this perspective, it becomes very difficult to make rational decisions.
Technical indicators can help, provided you know what they say
Indicators do not replace reading the market. They are mainly used to confirm, filter or qualify a hypothesis. For a beginner, moving averages are still a good starting point. When price moves above an upward moving average, it suggests positive momentum. When it falls permanently below an average which flattens or reverses, the signal becomes more fragile.
Moving averages, however, have a flaw: they react with a delay. This is normal, since they are calculated from past data. They are therefore useful for following a trend, less for anticipating a reversal very early.
RSI can also be useful, but it is often misinterpreted. A high RSI does not necessarily mean you should sell. In a strong uptrend, an asset can remain in the overbought zone for a long time. The interest of the RSI is more to compare the relative strength of the movement and to identify certain divergences, not to give a magic signal to buy or sell.
The MACD helps visualize the acceleration or slowdown of dynamics. Here again, it works better in addition to price reading than alone. The more indicators you use, the more confusion you risk creating if you don’t know exactly what you’re looking for.
A trend is never just about the graph
In financial markets, prices also change depending on a context. A trend in a stock can be driven by improving earnings, a revised outlook, a recovering sector or a rate cut. In crypto, adoption, regulation, overall liquidity or flows to ETFs can play a major role.
That is, the graph shows what is happening, but the context helps you understand why it is happening. The two approaches are complementary. If you see an asset break important resistance as volumes increase and fundamentals improve, you have a stronger set of clues than just an isolated price movement.
This does not mean that we should expect absolute certainty. She doesn’t exist. On the other hand, the more the signals converge, the more usable your reading becomes.
Know how to recognize false signals
The market loves to trap investors in a hurry. A bullish false start after a long decline is common. A breakout of support that immediately reintegrates is just as important. This is why identifying a trend is not only about spotting a movement, it is also about evaluating its reliability.
A good reflex is to ask yourself what would invalidate your analysis. If you think an uptrend starts, at what level do you consider the assumption to be false? This question changes everything, because it forces you to think in probabilities rather than certainties.
You should also be wary of market periods that are too emotional. After a major announcement, a tweet, a rumor or a macroeconomic figure, prices can react violently without creating a lasting trend. The first move is not always the right one. Sometimes waiting for confirmation costs a few percent, but avoids a much more expensive mistake.
A simple method for beginner investors
If you’re just starting out, there’s no need to look for ultra-sophisticated reading. A clear and repeatable method is better than an arsenal of poorly mastered tools. Start by answering four questions.
What is thedirection of the price over the last few weeks or months? Are the peaks and troughs going in the same direction? Is the movement supported by consistent volumes? And above all, does the general market context strengthen or weaken this reading?
If these answers point in the same direction, you may be seeing an actionable trend. If they contradict each other, it is often wiser to wait. Doing nothing is also an investment decision.
This discipline is valuable because it reduces impulsivity. Many mistakes come from the need to act quickly. However, in the markets, reading quality often counts more than execution speed.
What AI can really do to identify a trend
Reading a market requires time, attention and a certain mental rigor. This is precisely where an artificial intelligence tool can help. Not to predict the future, but to process a large volume of data more quickly, identify coherent signals and highlight what the human eye may miss.
An AI can compare multiple time units, monitor volumes, detect breakouts, summarize fundamental context or report technical discrepancies without fatigue or distraction. For an individual investor, this saves time, reduces mental load and arrives at a clearer decision.
At Yapuka Investir, this logic is central: using automation and AI agents to better analyze, not to replace judgment. The tool can help you structure your reading of the market and filter out the noise, but the final decision always remains human. It is this combination of method, data and perspective that allows lasting progress, without promise of gain and without depending on a simple stroke of luck.