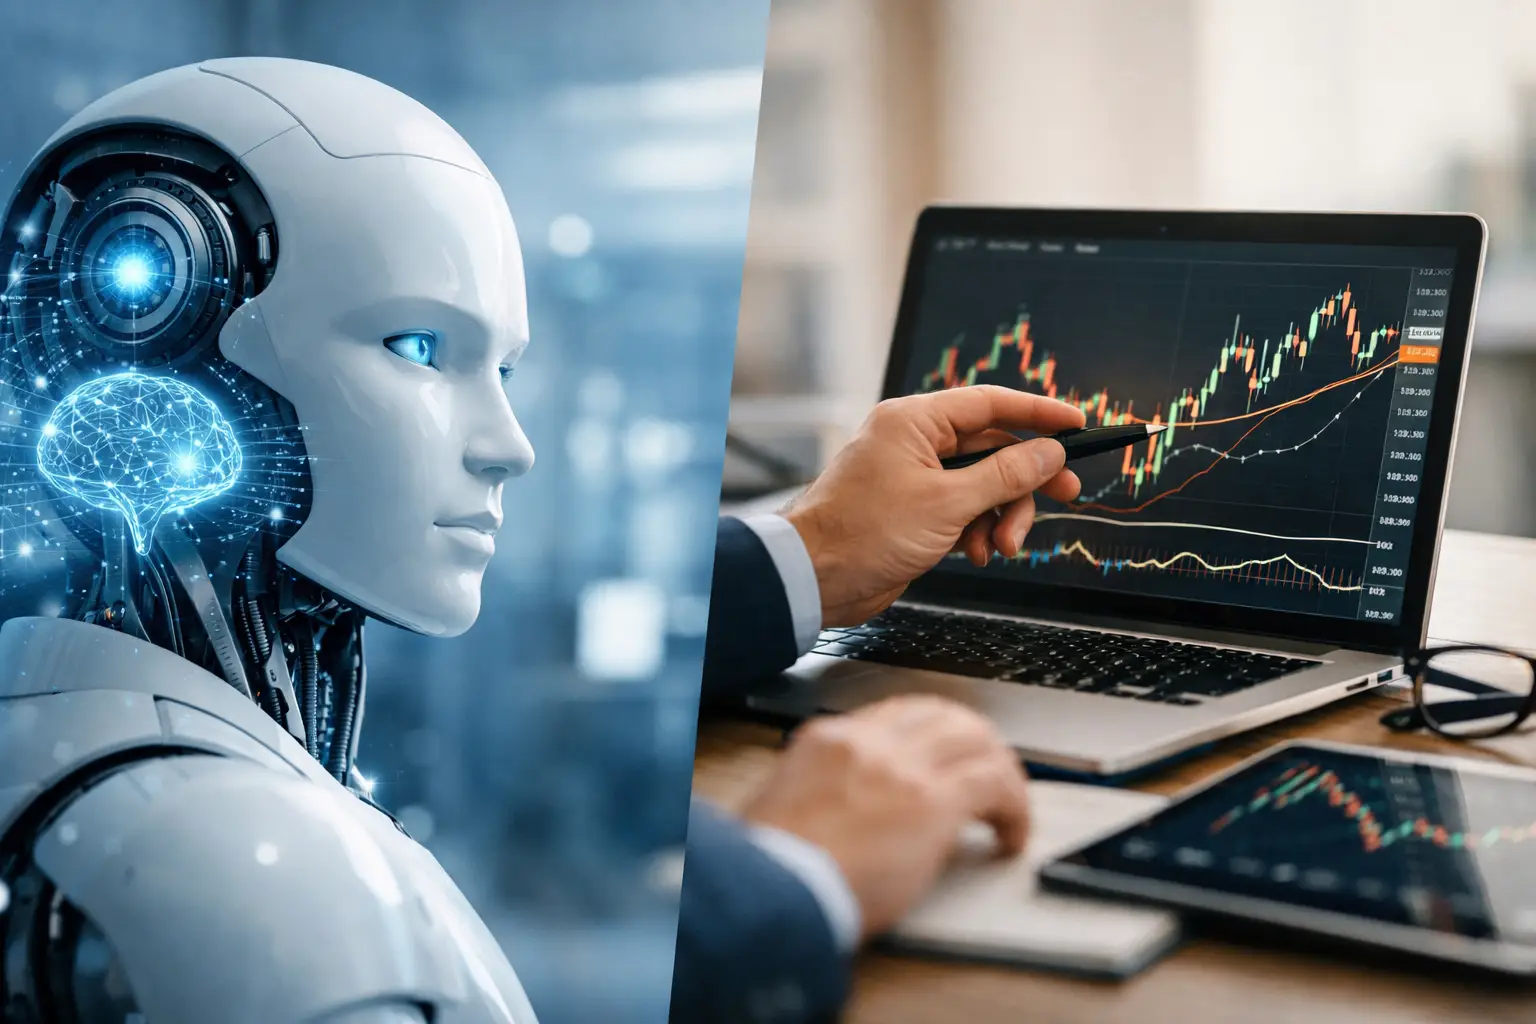
A chart can seem obvious in hindsight: an uptrend, a support that held, an indicator that crossed at the right moment. In real time, the reading is much less clear. When faced with the choice of “AI or technical analysis,” many retail traders pit two approaches against each other that, in practice, meet different needs. One structures price observation; the other can accelerate information processing and highlight signals that are hard to track manually.
The real question is not which method “wins.” It’s about understanding what each can bring to a decision, what their limits are, and how to avoid asking them for what they cannot provide: certainty.
AI or Technical Analysis: Two Different Roles
Technical analysis studies price behavior, volumes, and sometimes volatility. It starts from a simple idea: markets reflect, at any given moment, the expectations of participants. The chart then becomes a tool to spot trends, key price zones, and moments when the balance between buyers and sellers shifts.
A trader can, for example, identify a trend through a series of higher highs and higher lows. They can then monitor a moving average, a support level, or a resistance zone to define their scenario. Technical analysis mainly helps organize a market reading and anticipate action conditions: entering, waiting, reducing a position, or exiting if the scenario is invalidated.
Artificial intelligence does not replace this reasoning by default. It refers to systems capable of processing large amounts of data, identifying patterns, or generating analysis based on rules, statistical models, or machine learning. In investing, AI can analyze multiple timeframes simultaneously, compare assets, detect volume anomalies, or synthesize market data.
The key difference is this: technical analysis provides a reading framework; AI can help apply this framework at scale and with greater consistency. AI is not necessarily better at interpreting context. However, it is often faster at filtering, sorting, and monitoring.
What Technical Analysis Does Well
For a beginner to intermediate investor, technical analysis remains a useful foundation because it forces you to formulate a testable hypothesis. Instead of saying “this token looks ready to go up,” you can specify: “the price remains above its support zone, volumes are rising, and the structure stays bullish as long as this level holds.”
This precision improves discipline. It also allows you to calculate risk before acting. If an invalidation point is known, position size can be adjusted to the maximum acceptable loss. This is far more important than searching for a supposedly infallible indicator.
Technical analysis is also accessible. A candlestick chart, volumes, supports and resistances, and one or two moving averages are enough to start. Adding ten indicators does not make an analysis more reliable. On the contrary, it can produce contradictory signals and encourage hesitation.
Its limitations are real, however. Indicators are generally calculated from past data. They often confirm a move after it has started and can generate false signals in a trendless market. Moreover, a chart does not tell the whole story: macroeconomic announcements, regulatory changes, crypto protocol hacks, or earnings releases can abruptly change market conditions.
What AI Can Add to Your Method
The main value of AI is not to precisely predict the next candlestick. It lies in its ability to reduce information noise. A trader following twenty assets, multiple timeframes, and market news quickly faces data overload. AI can then serve as a filter.
For example, it can flag assets with abnormally high volume, spot those approaching a major resistance, compare the relative strength of several cryptocurrencies, or detect unusual changes in volatility. It can also turn raw data into useful questions: is the trend consistent between the daily and four-hour charts? Is the move supported by volume? Which levels are most watched?
AI agents also bring continuity. A human gets tired, misses an alert, or changes their mind after a sharp move. An automated tool can apply the same criteria at set times and log observations. This consistency is valuable for building a trading journal and evaluating a method over time.
But AI has its own blind spots. The quality of its analysis depends on the quality, freshness, and scope of the data used. A model trained on a bull market may react poorly to a prolonged bear market. A statistical correlation can vanish as soon as the context changes. Finally, a confidently worded answer is not proof of reliability.
Therefore, AI should be asked to explain the observed elements, the assumptions made, and the limits of its signal. A tool that displays a score or recommendation without context should be treated with caution.
The Risk of Confusing Automation with Decision-Making
Automation sometimes gives an illusion of control. Seeing a dashboard, alerts, and probabilities can encourage more frequent action, when the best decision is sometimes to do nothing. The frequency of signals should never become a goal in itself.
Another risk is confirmation bias. If you ask AI to validate a position you already have in mind, it may produce an analysis that seems convincing without really challenging the scenario. To limit this bias, it’s better to ask contradictory questions: what would invalidate the trend? What level would make the entry less relevant? What information is missing before making a decision?
AI also does not eliminate market risk. Cryptocurrencies can experience rapid moves, large spreads between platforms, and variable liquidity depending on the asset. The capital committed, diversification, leverage level, and exit rules remain human decisions.
A Simple Method to Combine Both
The most useful combination often starts with technical analysis, then uses AI as a layer of control and monitoring. This sequence avoids fully delegating your market understanding to a tool.
Start by defining your timeframe. A position held for several weeks is not read like an intraday trade. On a longer horizon, the weekly and daily trends will generally carry more weight than minute-to-minute swings. Next, choose a liquid asset and observe its price structure: trend, key levels, volume, and volatility.
Formulate your scenario in simple language. For example, you might consider an asset constructive as long as it holds a support zone, but wait for volume confirmation before entering. Also define invalidation: if the price closes below this level for a while, your hypothesis should be revised, not defended at all costs.
This is where AI becomes especially useful. Ask it to monitor the identified levels, compare the asset’s behavior to its sector, note volume changes, or list events likely to increase volatility. The tool can also produce a daily summary, which helps avoid compulsively checking charts.
Finally, record the decision and its outcome. Note the context, the signal, the accepted risk, any target, and the reason for exit. After a series of decisions, this journal helps distinguish a coherent method from a string of impressions. Neither AI nor technical analysis compensates for lack of follow-up.
Which Indicators to Prioritize at First?
There is no universal combination. To avoid unnecessary complexity, it’s reasonable to start with four complementary elements: price structure, supports and resistances, volumes, and a trend measure like a moving average. An oscillator such as the RSI can complement this reading, but should not be used alone.
A high RSI does not automatically mean an asset will fall. In a strong uptrend, it can stay high for a long time. Similarly, crossing a moving average is no guarantee of continuation. The value comes from the convergence of signals and the context: overall trend, volume, price level, and defined risk.
AI can help check this convergence across multiple assets without turning the analysis into a black box. The goal is not to receive a buy or sell order, but to know where to focus your attention and which conditions to monitor.
Making AI Work with Technical Analysis
A clearer decision rarely starts with a spectacular prediction. It starts with organized data, an explicit scenario, and a well-understood risk rule. Technical analysis gives the vocabulary to read the market; AI can analyze more data, spot important signals, save time, and reduce mental load.
An AI agent or automated tool, like those offered by platforms such as Yapuka Trader, can thus become a method assistant: it monitors, synthesizes, and draws attention to useful changes. The final decision remains with the investor. AI helps you decide with more structure, but it never guarantees a profit and does not replace risk management or learning.