Yapuka Trader
Understand what the market is really doing before you take a position. Flows, positioning, options, journal and analyses, all in one dashboard, in five languages.
Swing trading · Bitcoin (BTC) only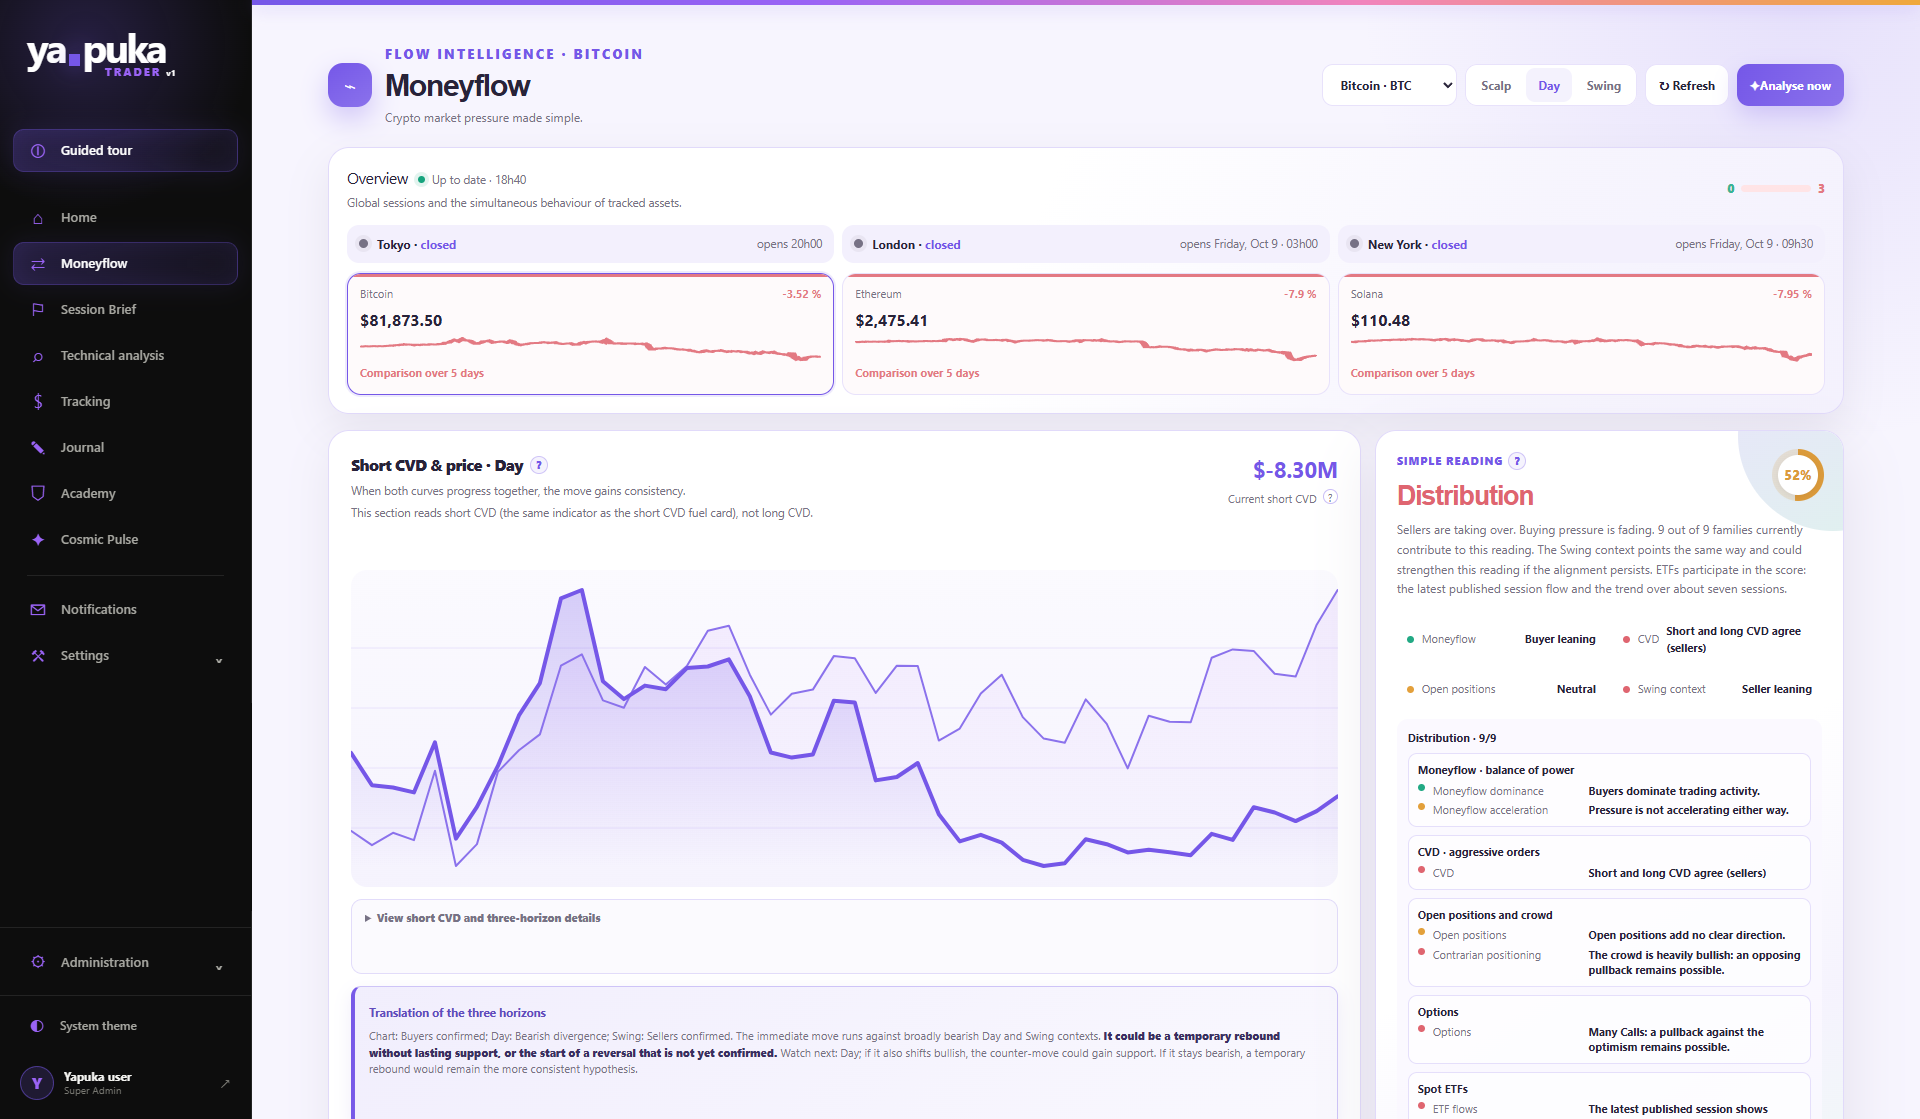
- French
- English
- Spanish (in progress)
- Portuguese (in progress)
- German (in progress)
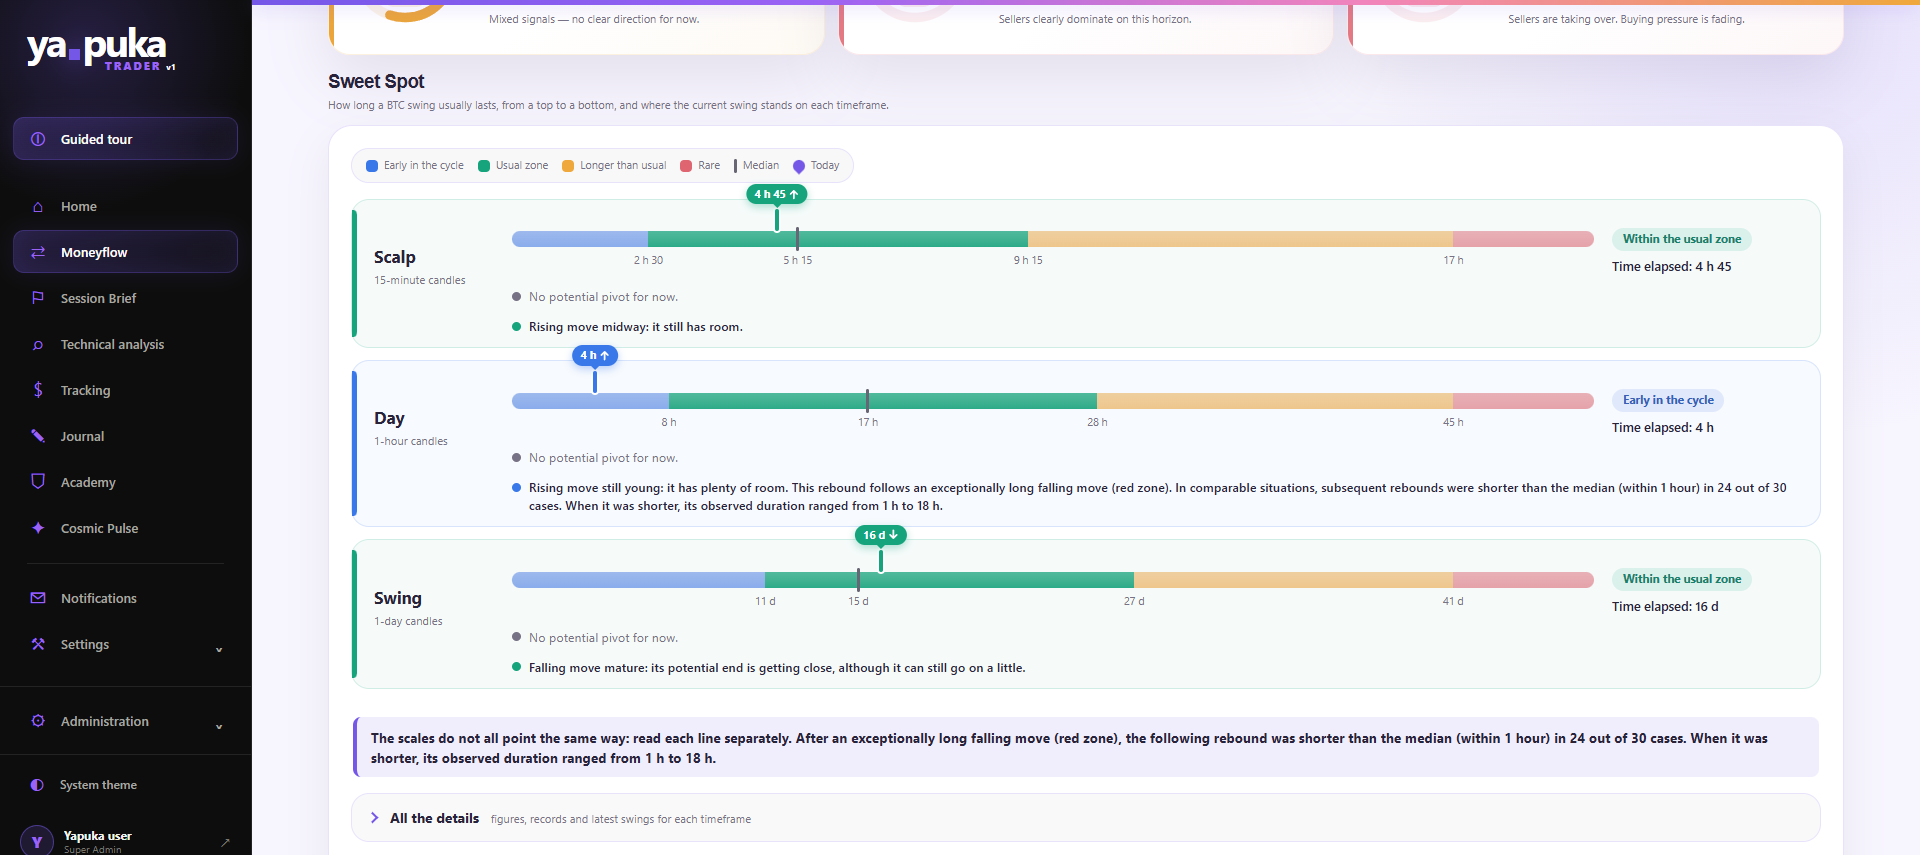
Sweet Spot: how much time does this move have left?
In swing trading, the costliest mistake is often a matter of timing: getting in when the move is already exhausted, or getting out just before it restarts. The Sweet Spot, in the Moneyflow module, answers the question every trader asks: do I still have time? Can the move still push on, or is it about to run out?
- It measures how long the current move has lasted, since the market’s last high or last low.
- It compares that with every move in the history Yapuka holds, showing the usual duration (the median) and the range the market normally stays in.
- It places the move in a clear zone: young, usual, longer than usual or rare. You read it in two seconds.
- When it spots a possible reversal, it tells you, noting that it is not yet confirmed.
Moneyflow module
The Moneyflow module:
the market read in four layers
A chart shows you the price, but not what moves it: who is buying, who is selling, who is trapped, and what option sellers will be forced to do. The Moneyflow module puts all of that on a single screen. Above all, it tells you in plain words whether all the signals point the same way or contradict each other.
- Main MoneyflowThe balance of money coming in or going out, candle after candle. It shows who is really in control: buyers or sellers.
- Short and long CVDThe breakdown of orders placed “at market”, buys on one side, sells on the other, over a short and a long period.
- Stablecoin dominanceThe share of money sitting on the sidelines, in digital dollars. It can come back into the market or move further away.
- Bitcoin ETF flowsMoney entering and leaving the ETFs, the most active fund of the day and the number of days in a row.
- Open InterestThe total number of positions open on the market. If it rises, new positions are being added and the move gains strength. If it falls, traders are closing positions and the move loses momentum.
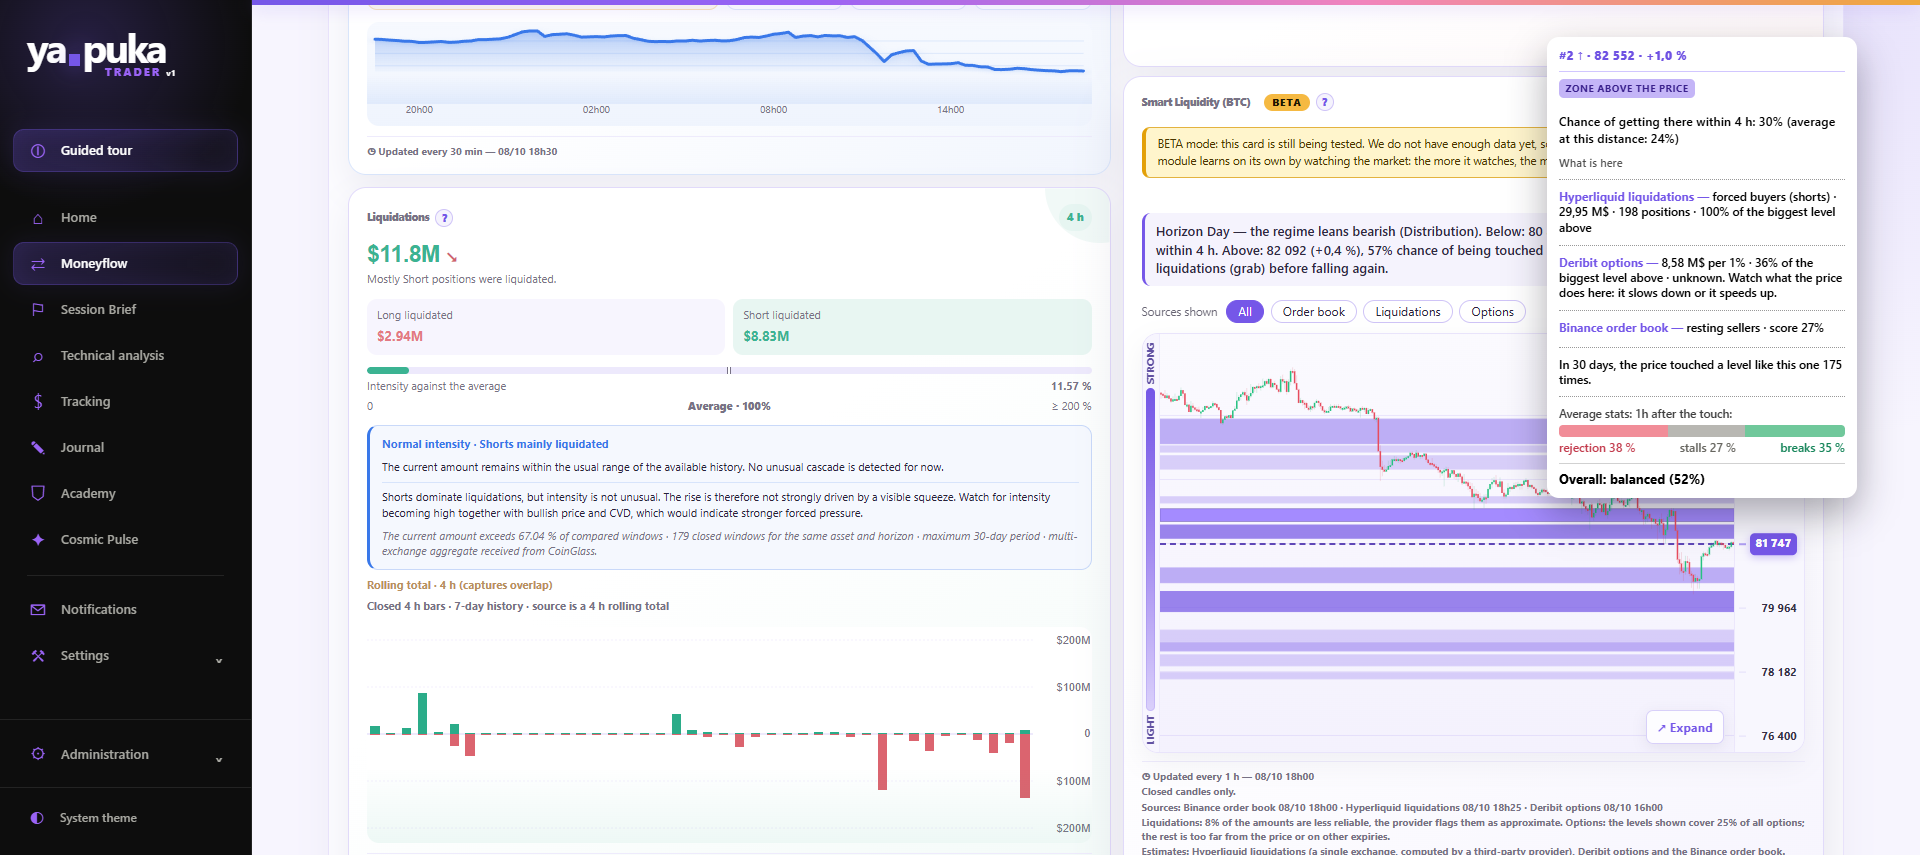
- LiquidationsTraders forced to close their position, on the buyer side or the seller side, and how intense it is.
- Critical divergencesThe moments when price and real money contradict each other, for example a rising price while sellers dominate.
- Smart Liquidity and squeezeThe zones where liquidity builds up, and the sides so loaded that they risk getting trapped.
- Long / ShortThe ratio between buyers and sellers across four sources, from the accounts of all traders to the largest accounts.
- FundingWhat the dominant side pays to keep its position. The more expensive it is, the more strained that side is.
- Fear & GreedThe market’s fear and euphoria index, with its change over one day and over seven days.
- US 10-year rate, dollar (DXY), oil (Brent)They blow at Bitcoin’s back or face it head-on.
- Options marketWho is betting on a rise or a fall, which expiries matter, and which price the market is “drawn” to.
- GEX and DEXWhat option sellers will have to buy or sell to hedge when the price moves. You also see how this pressure has changed over the days.
- Anchor zonesThe levels where the most money is committed, and what happens if the price breaks through them.
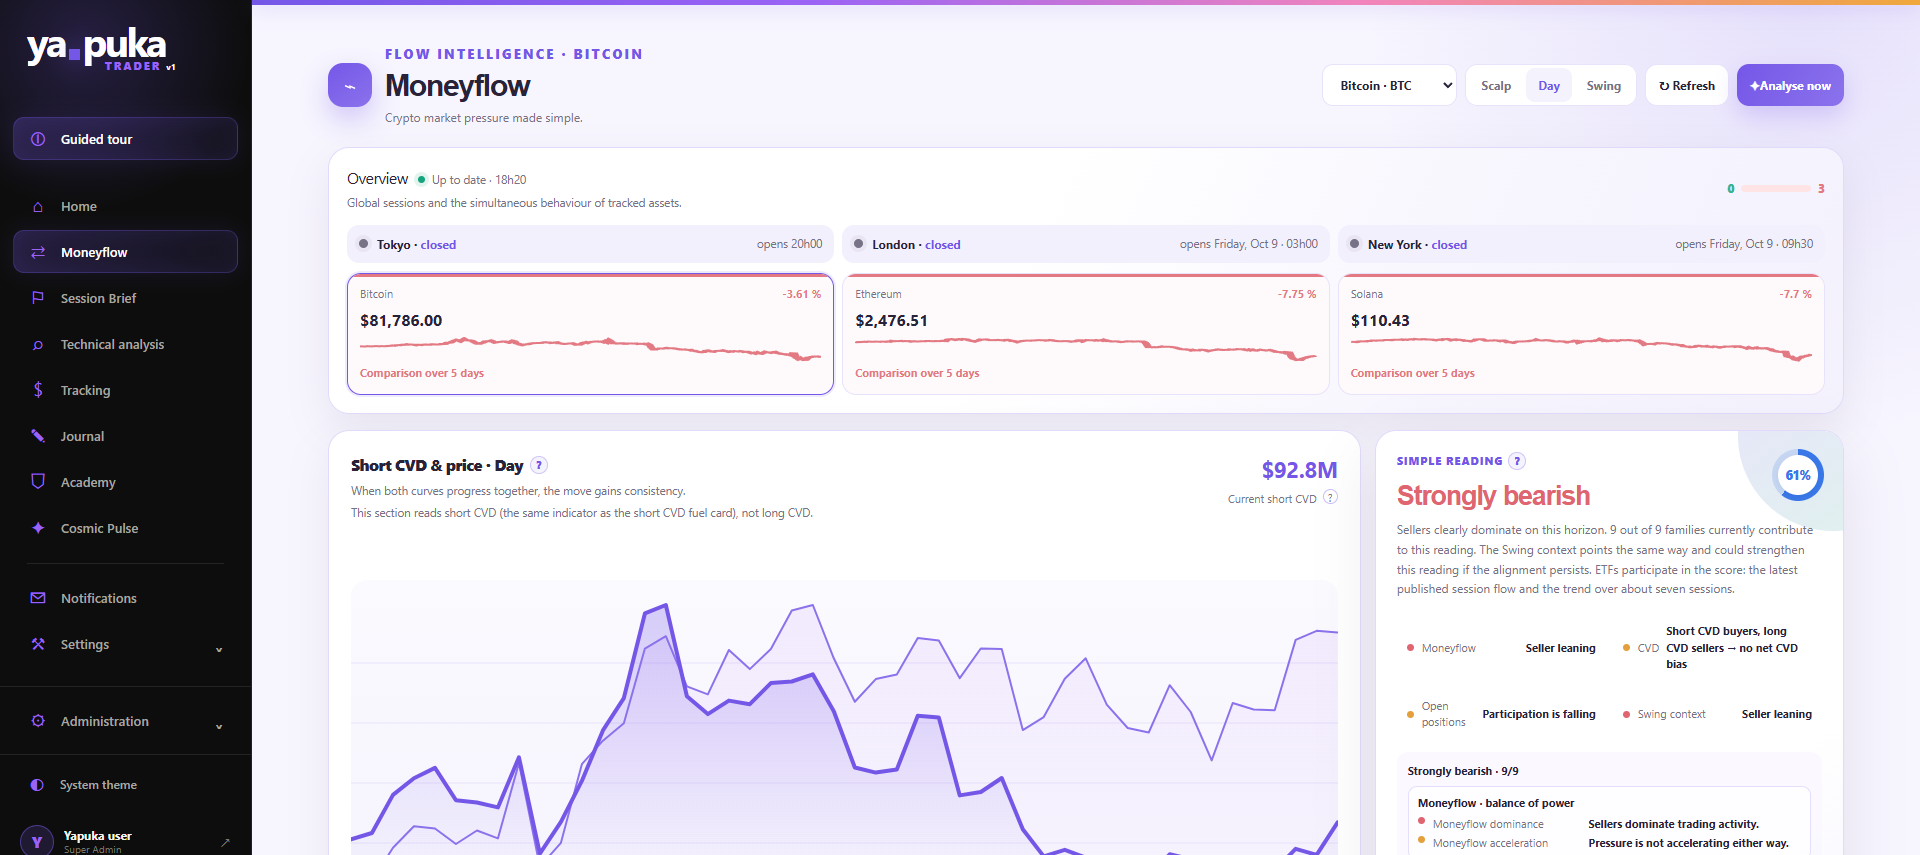
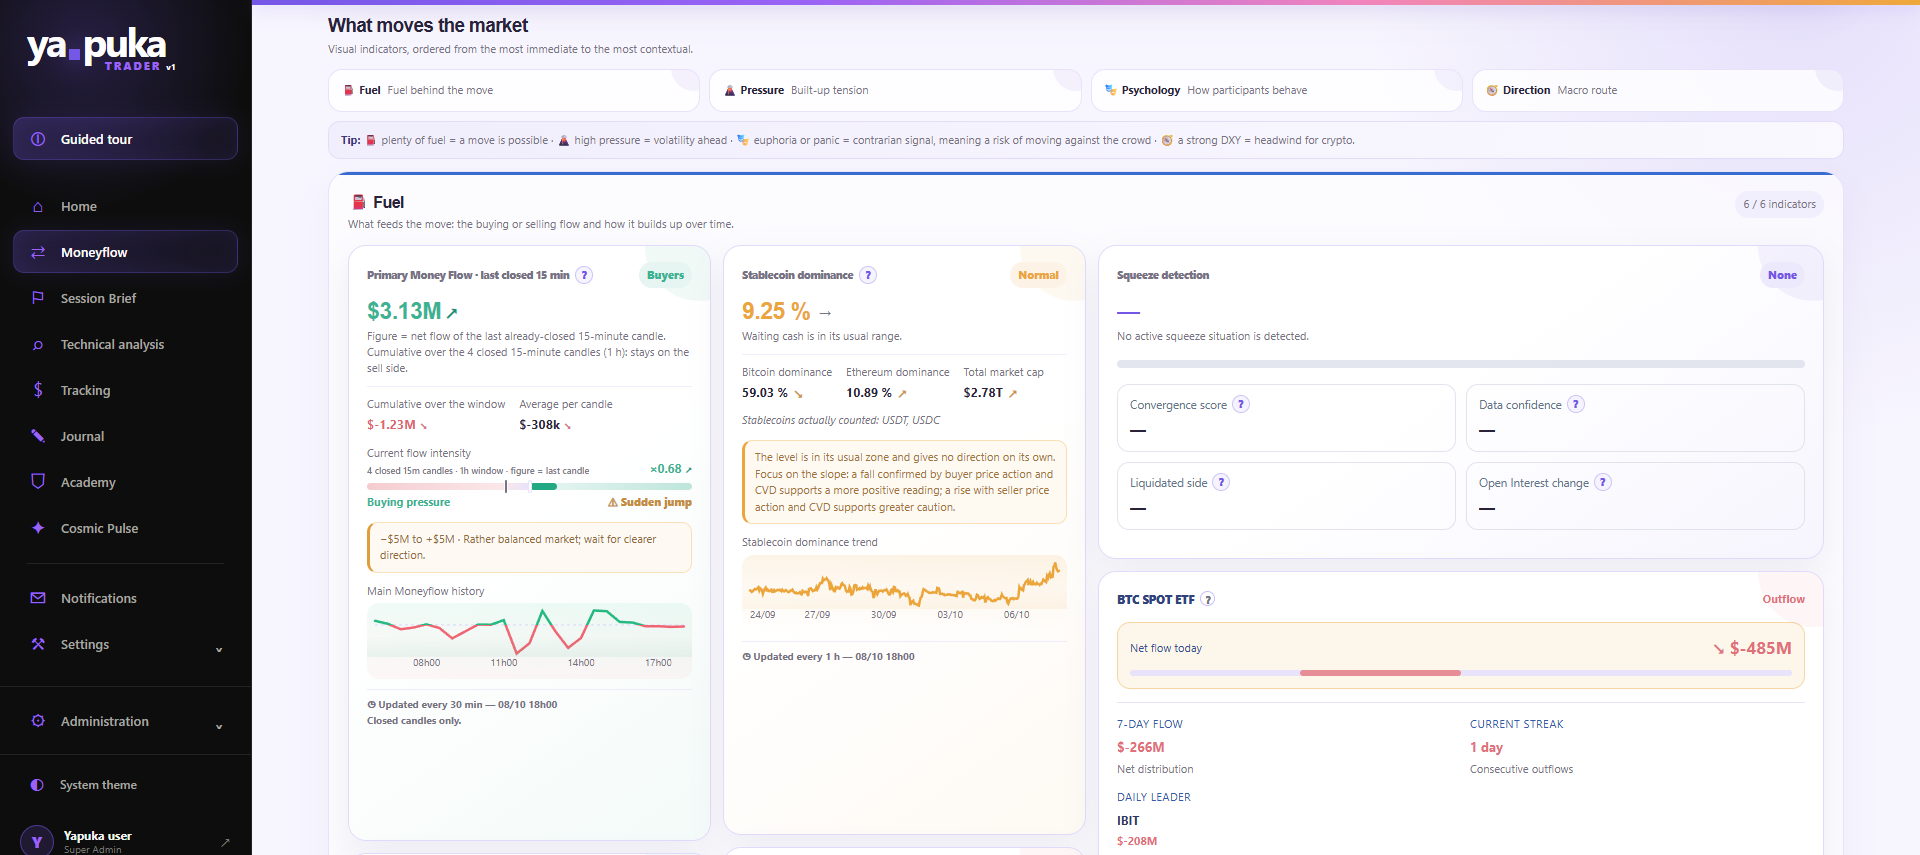
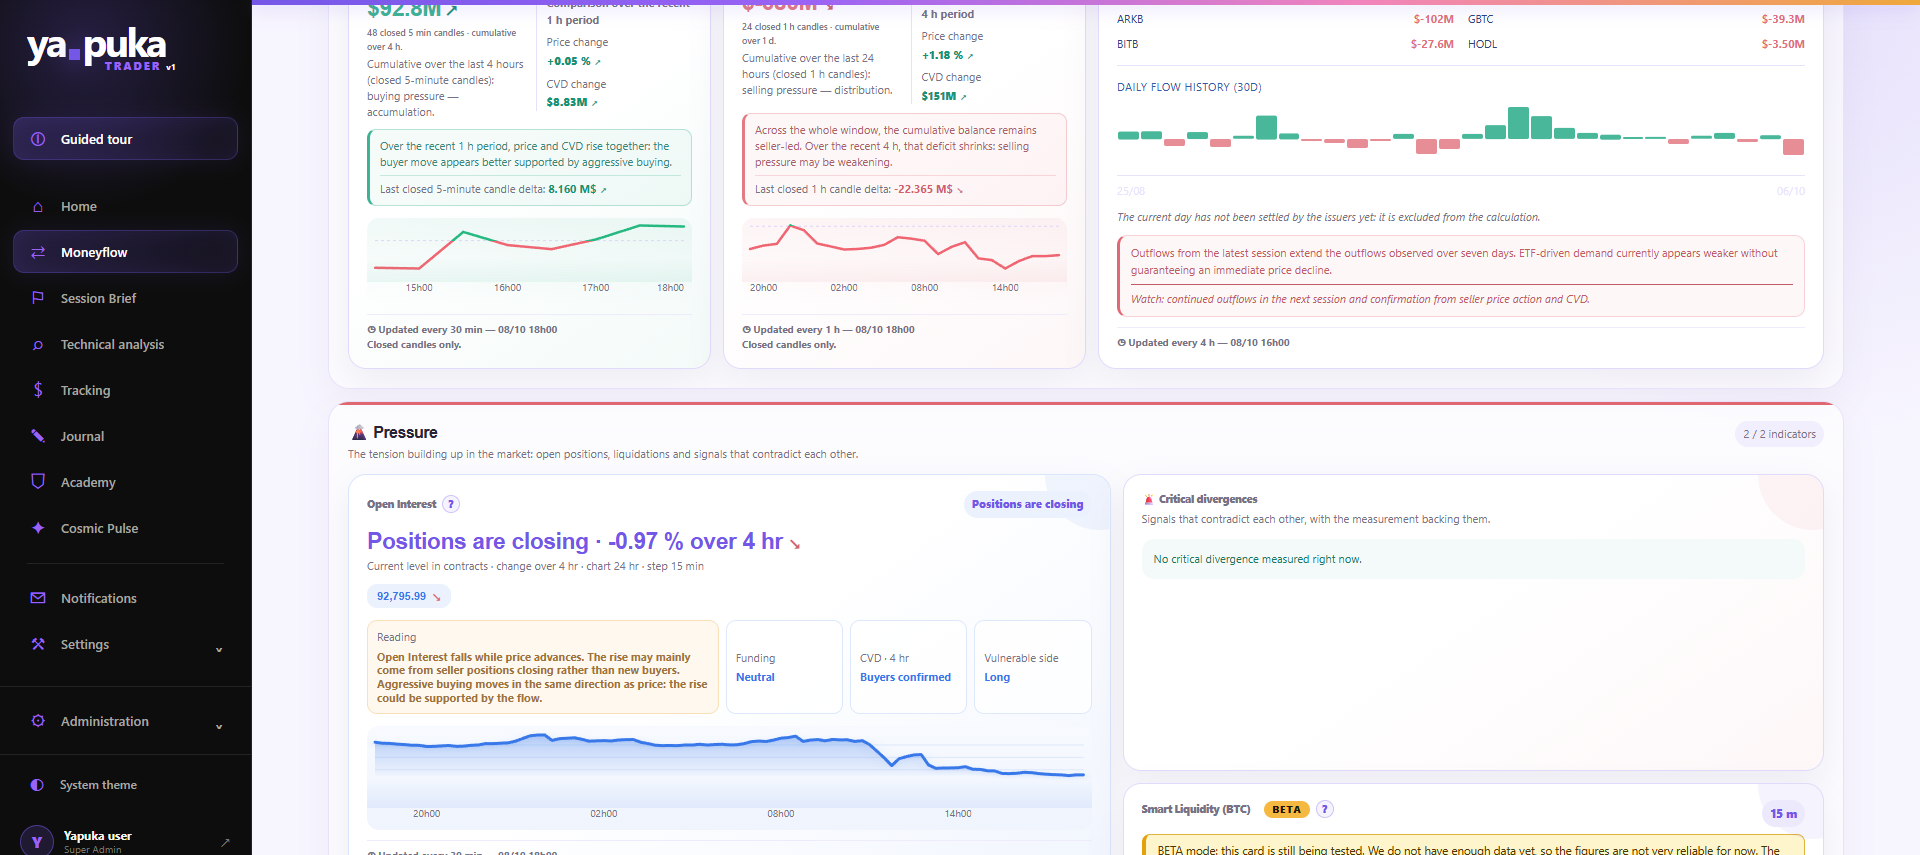
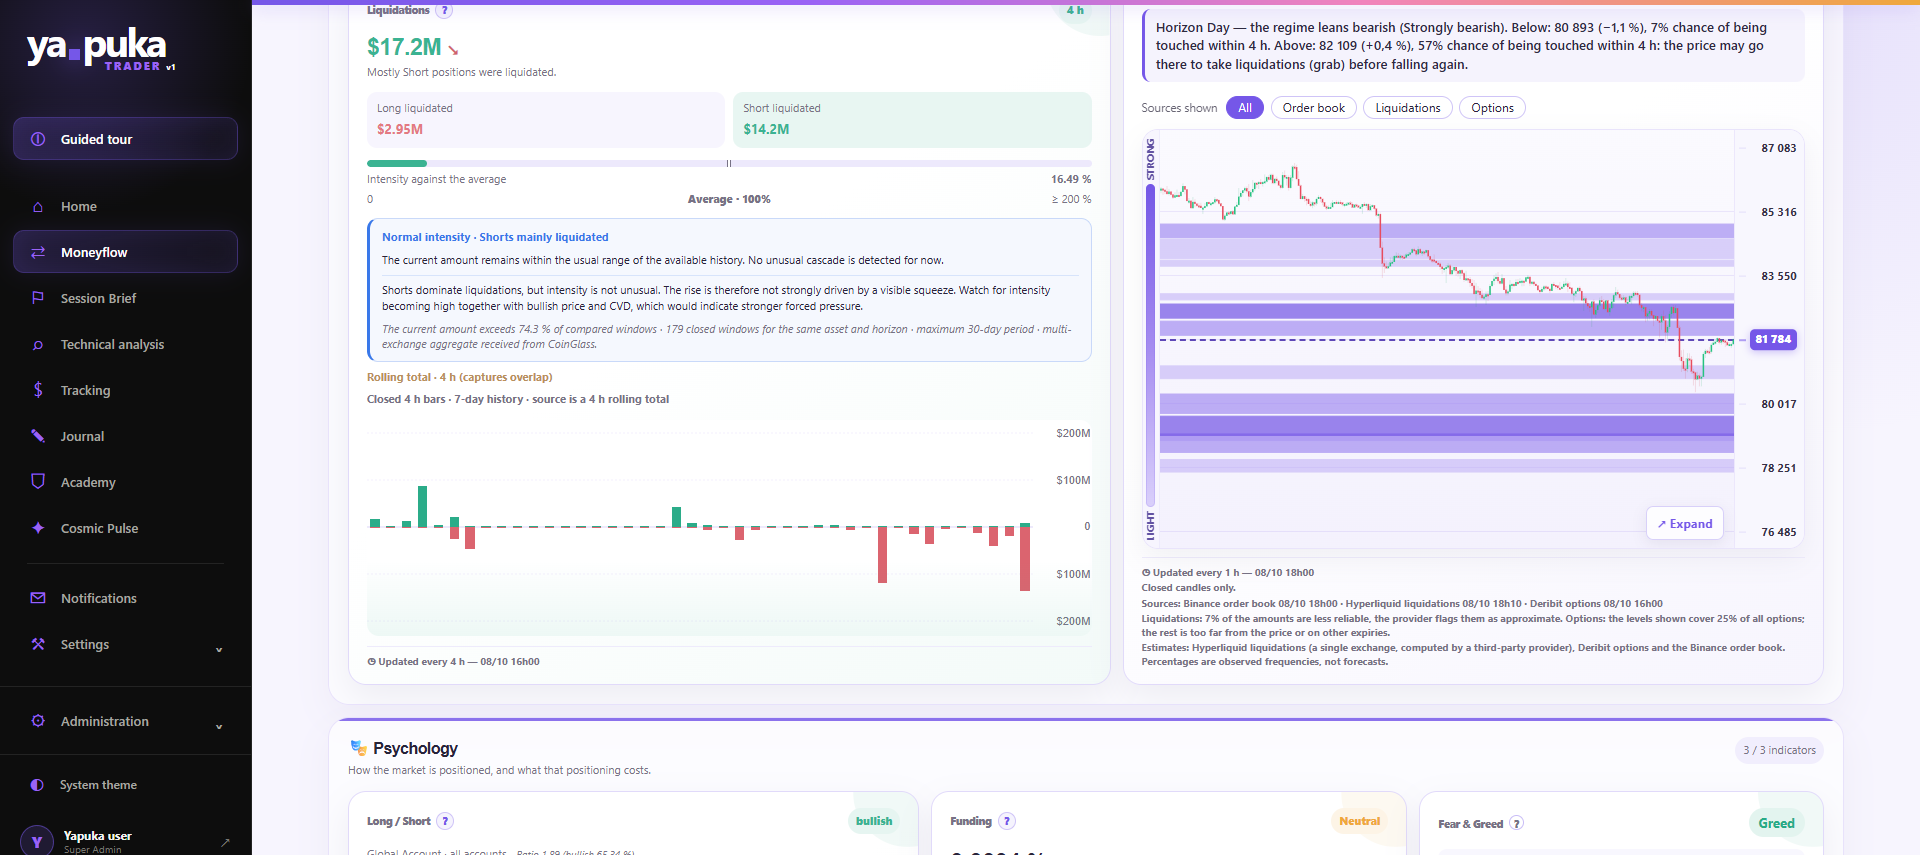
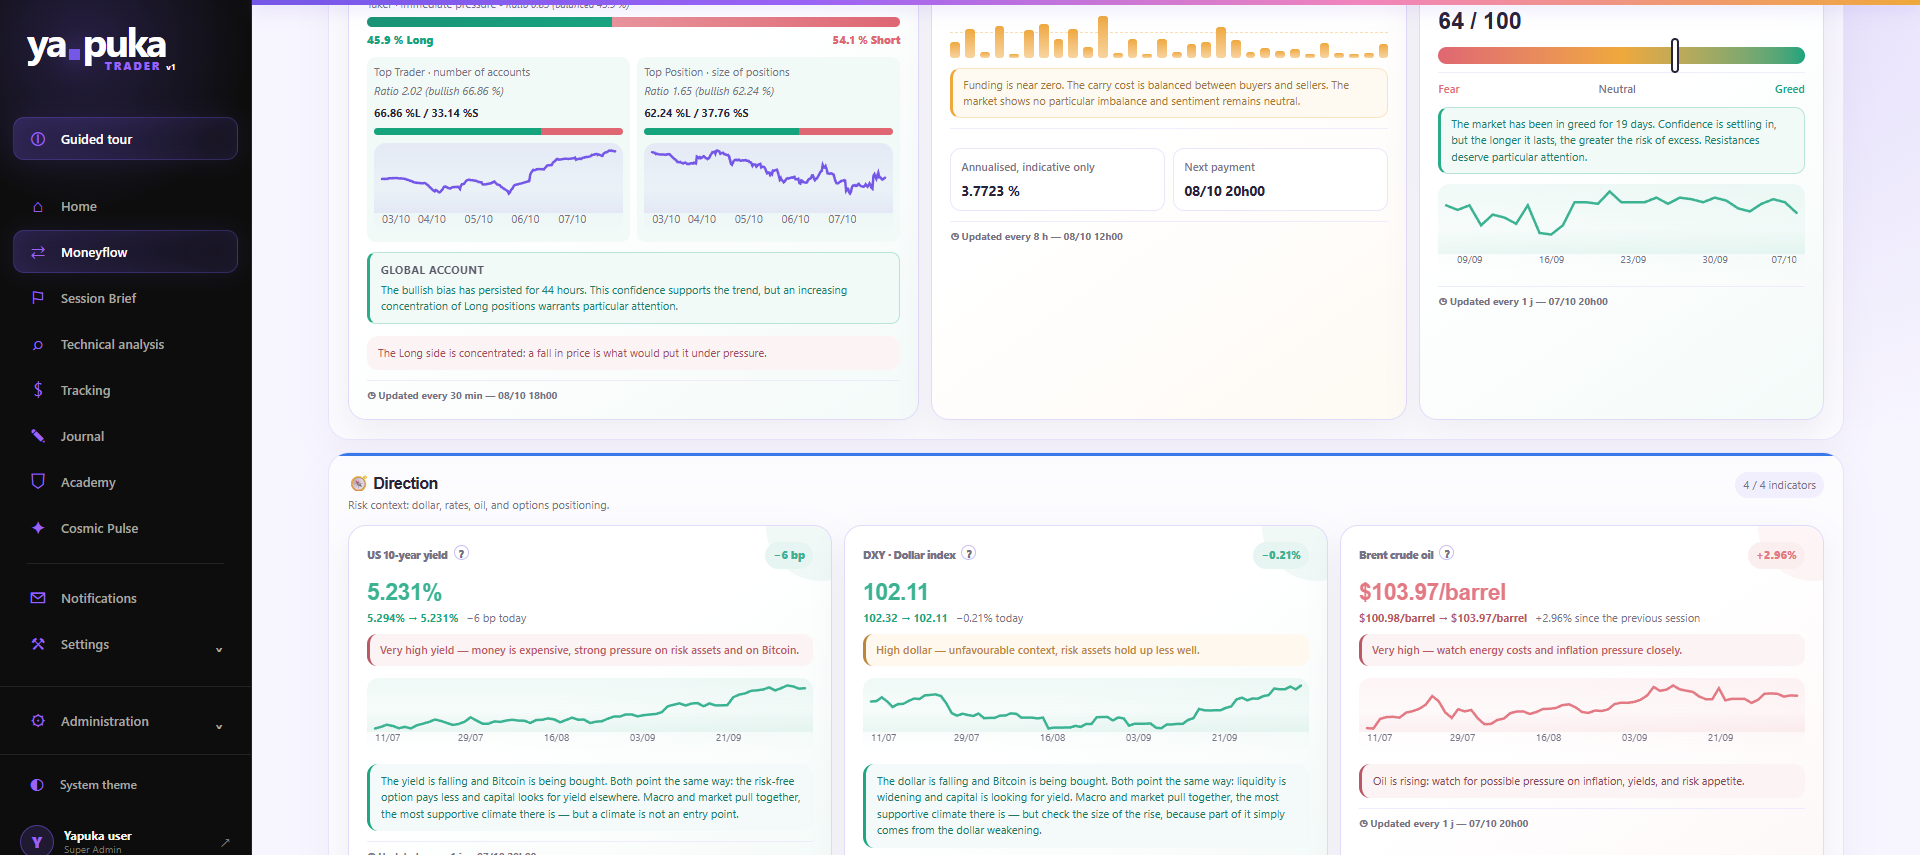
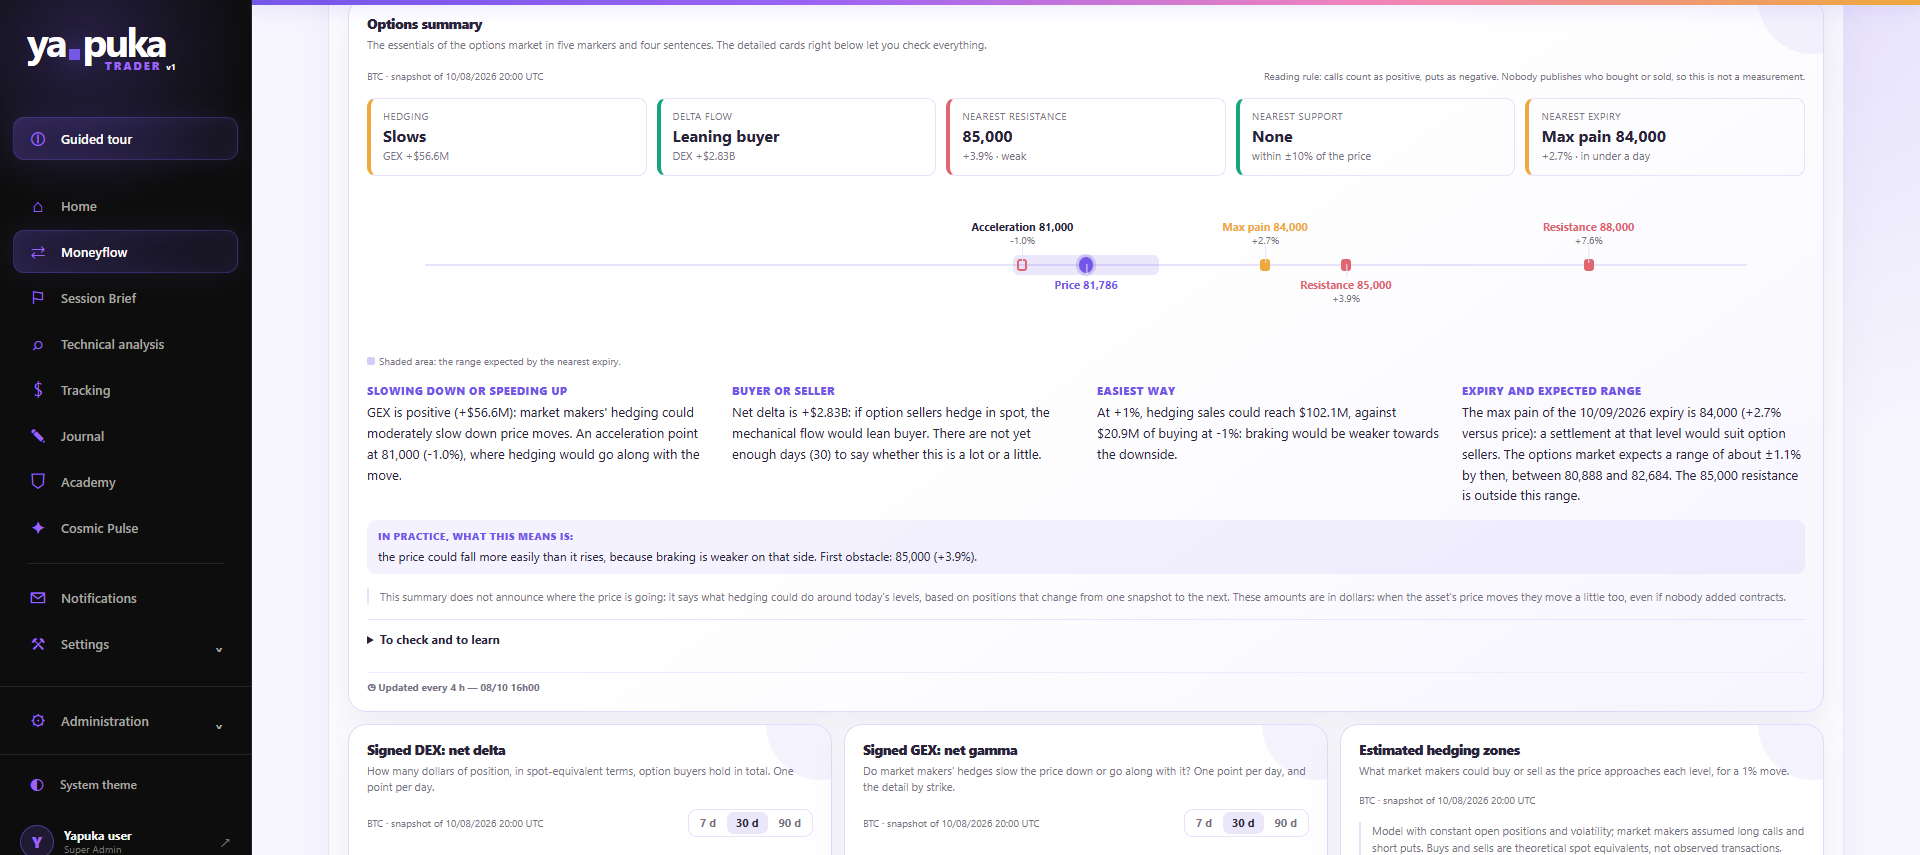
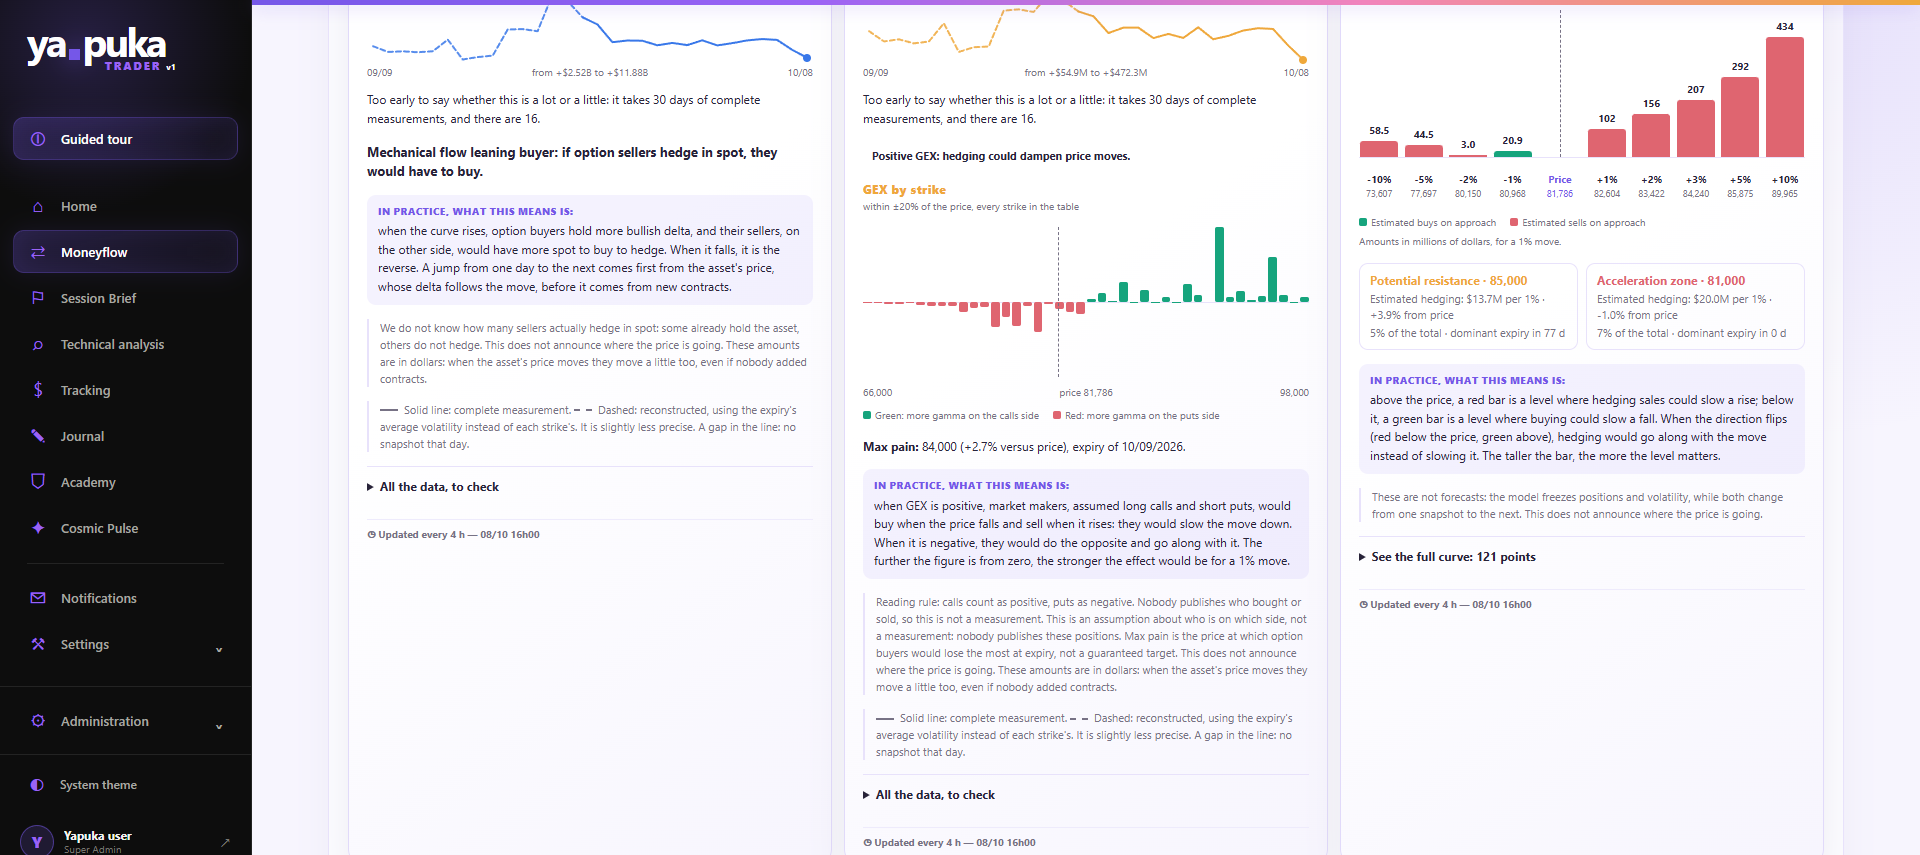
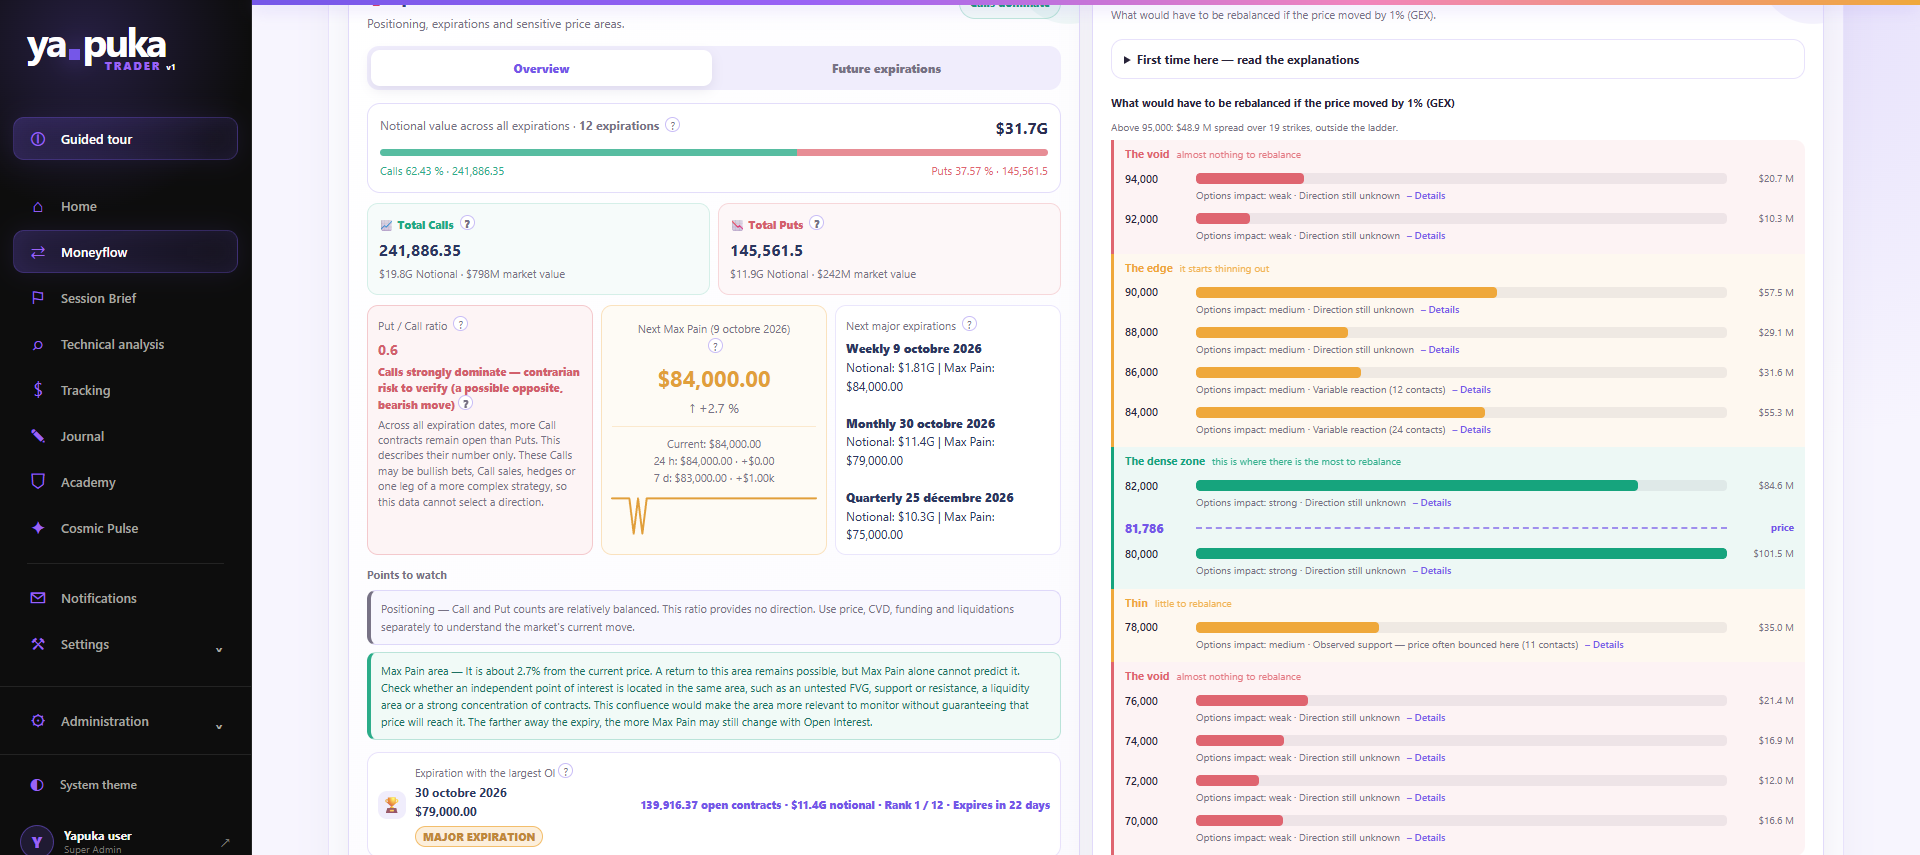
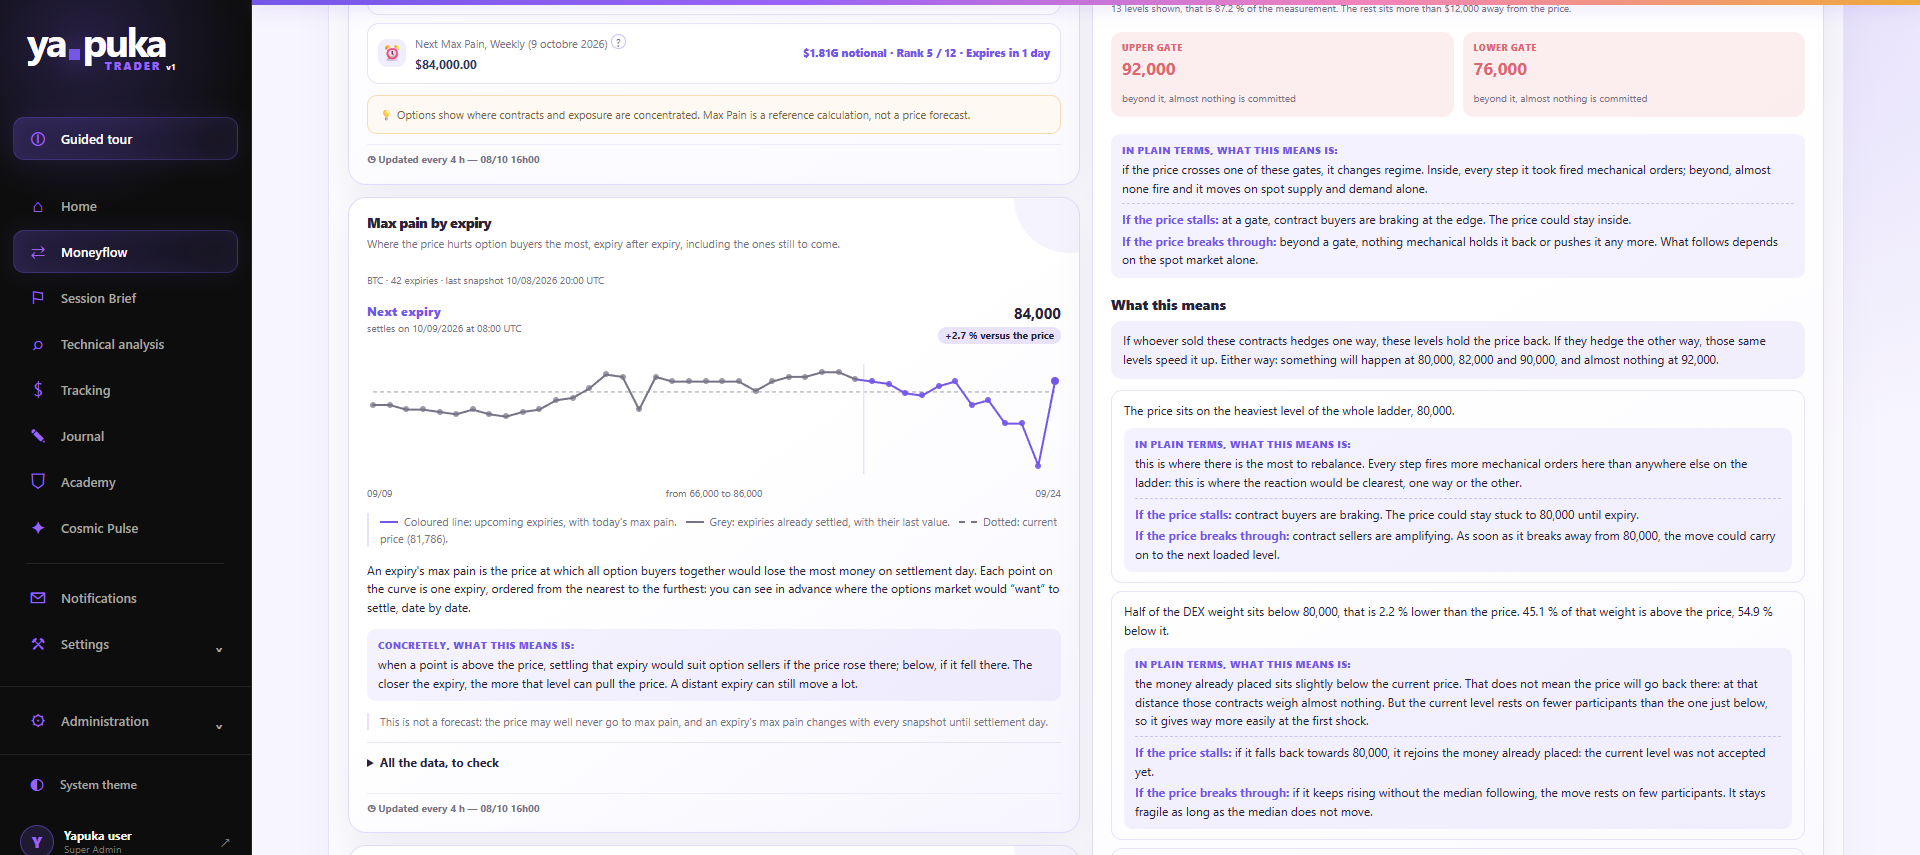
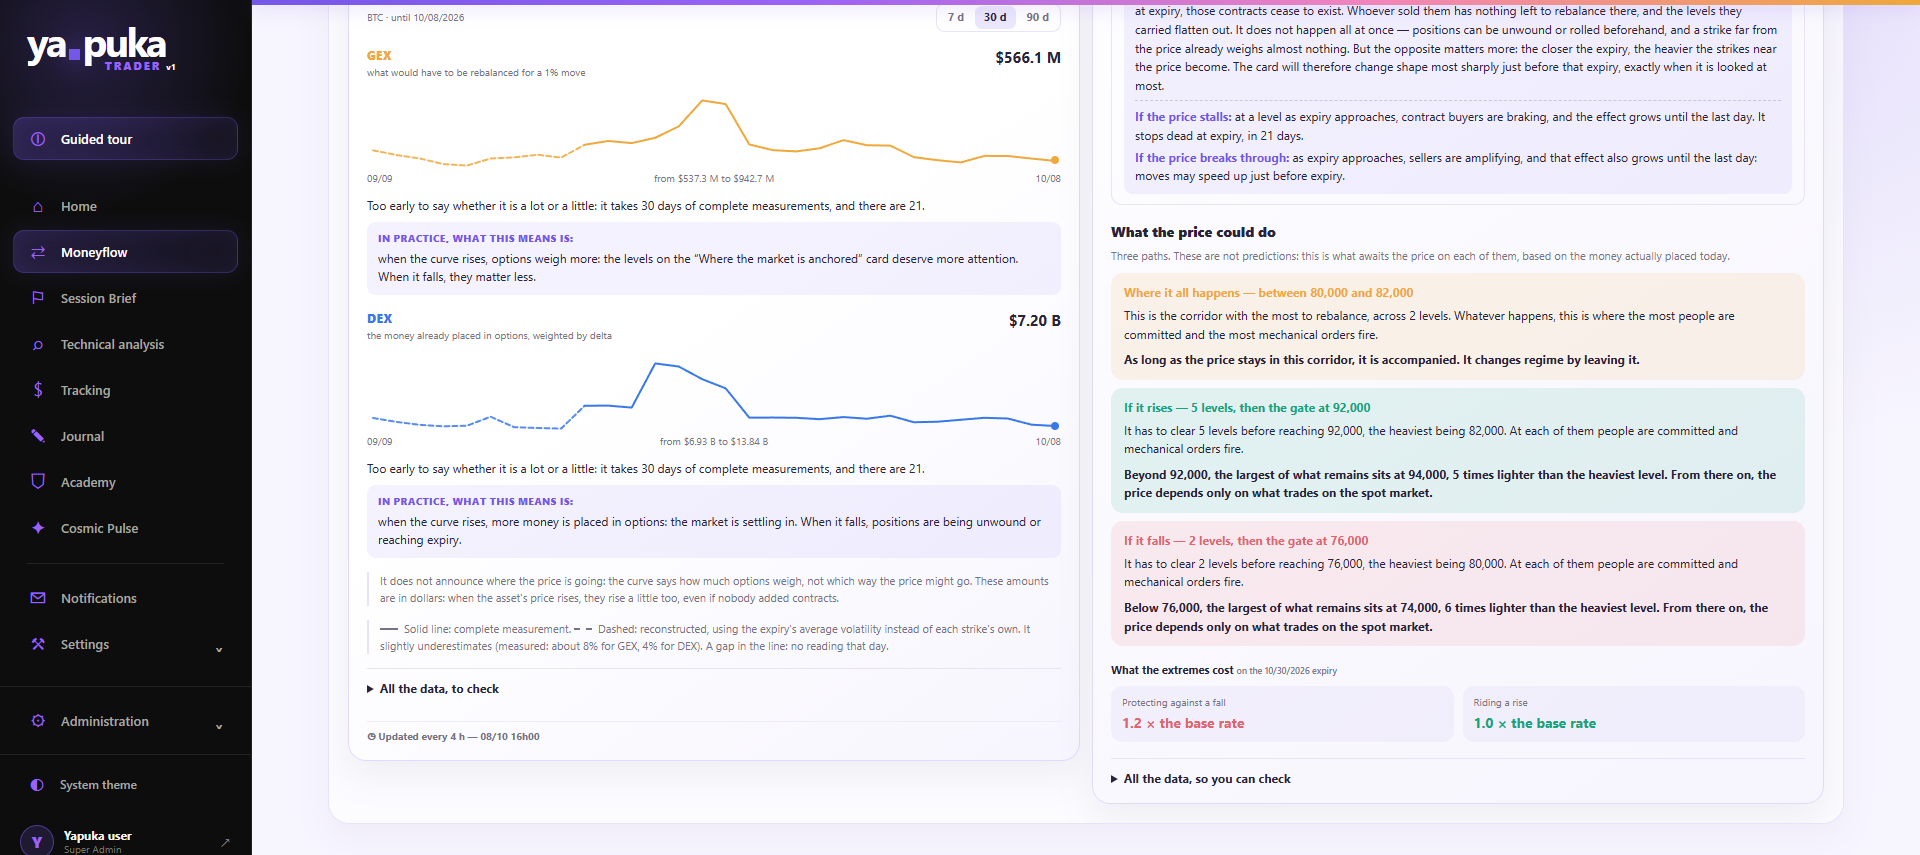
The Moneyflow module is built for newcomers: it explains every reading in plain language. And if that is not enough, you can run an analysis that translates all the numbers for you.
Example: buyers are paying a lot to stay long, positions are piling up, but real money is leaving. The rise rests on leverage, not on conviction.
One word to sum up the state of the market
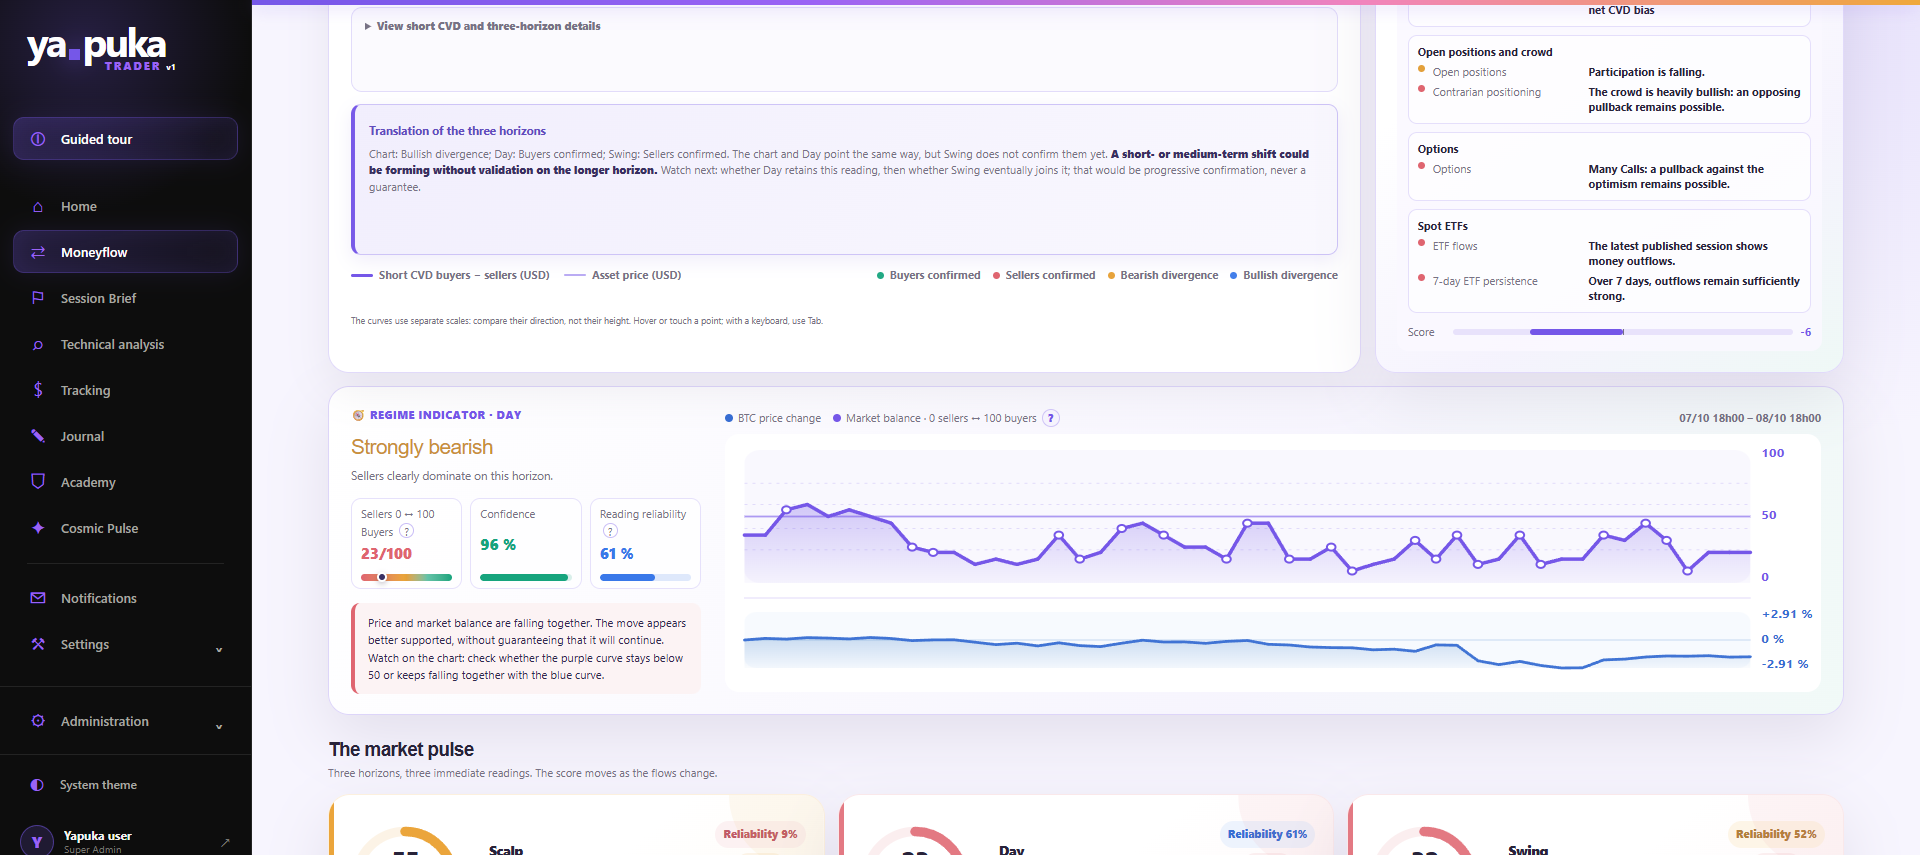
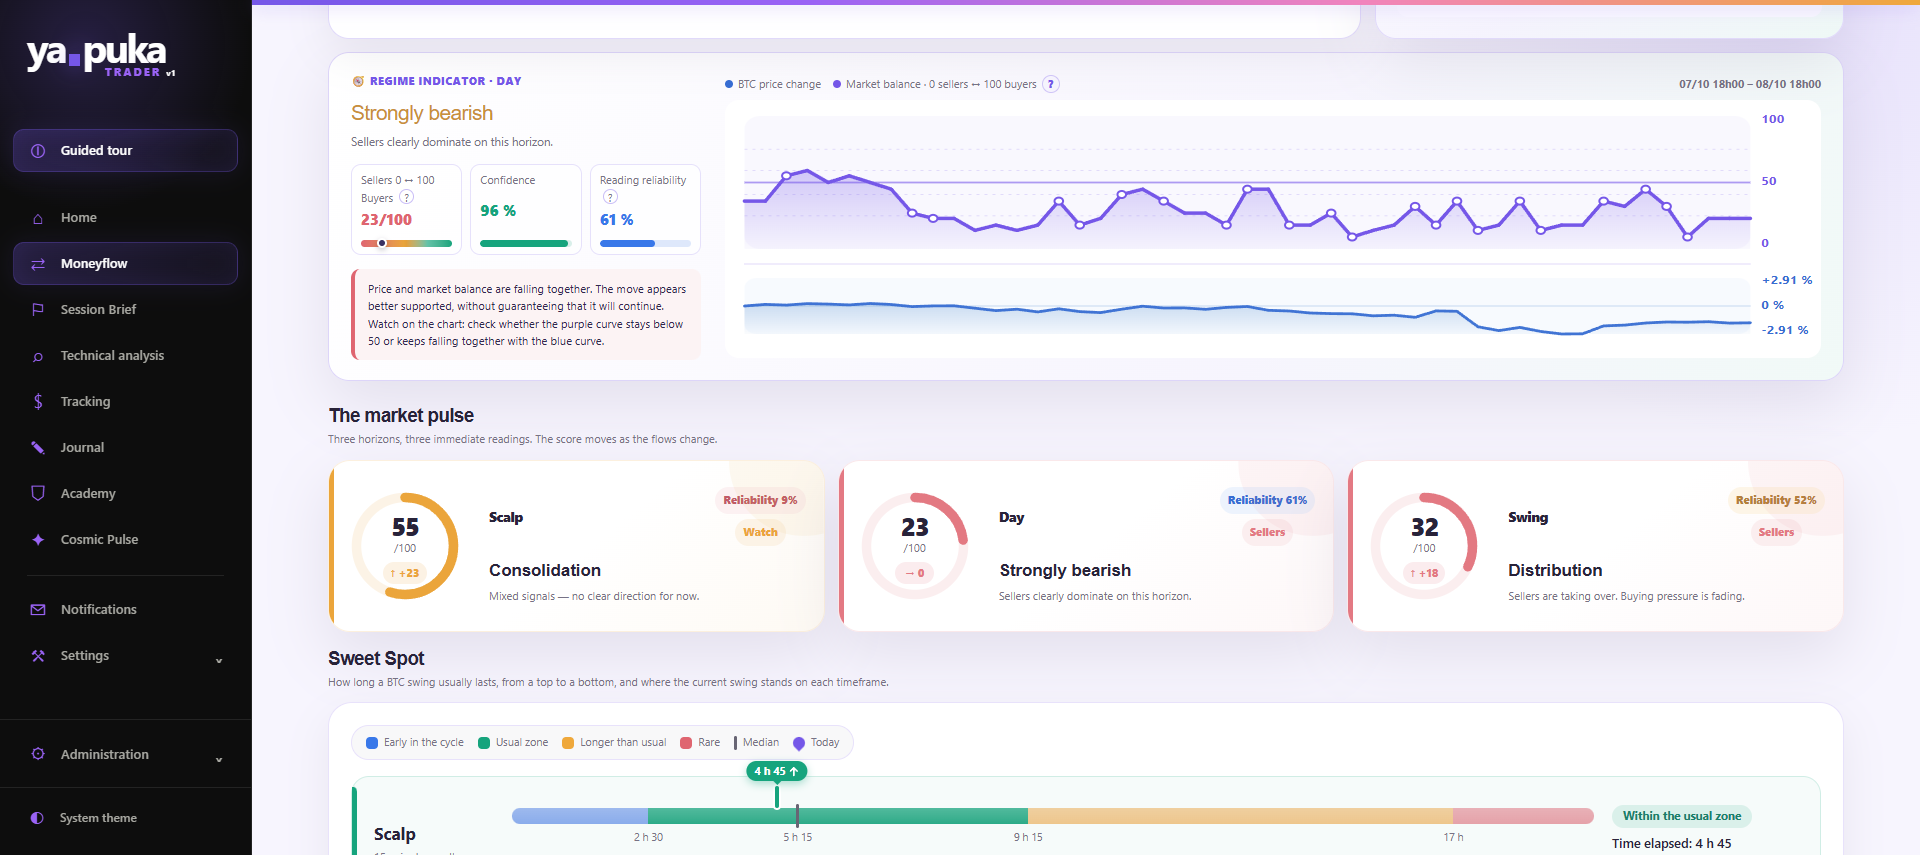
Accumulation, distribution… The regime sums up in one word what the money flows are doing. It comes with a score from 0 to 100 (0 for sellers, 100 for buyers), plus its confidence and reliability, so you know how far you can trust it.
- Three readings side by side, over three horizons
- A curve of the balance of power between buyers and sellers, compared with the price’s movement
- A sentence telling you what to watch on the curve
See where liquidity hides around Bitcoin
The module spots the levels where pending orders build up, the positions that would be forcibly closed and the options, from three sources: Binance’s order book, Hyperliquid’s liquidations and Deribit’s options.
Hover over a level: a bubble tells you what is there, how many times the price touched it over the last 30 days, and what happened next (rejection, stall or break).
This card is in beta: it learns from the market, and its figures become more reliable over time.
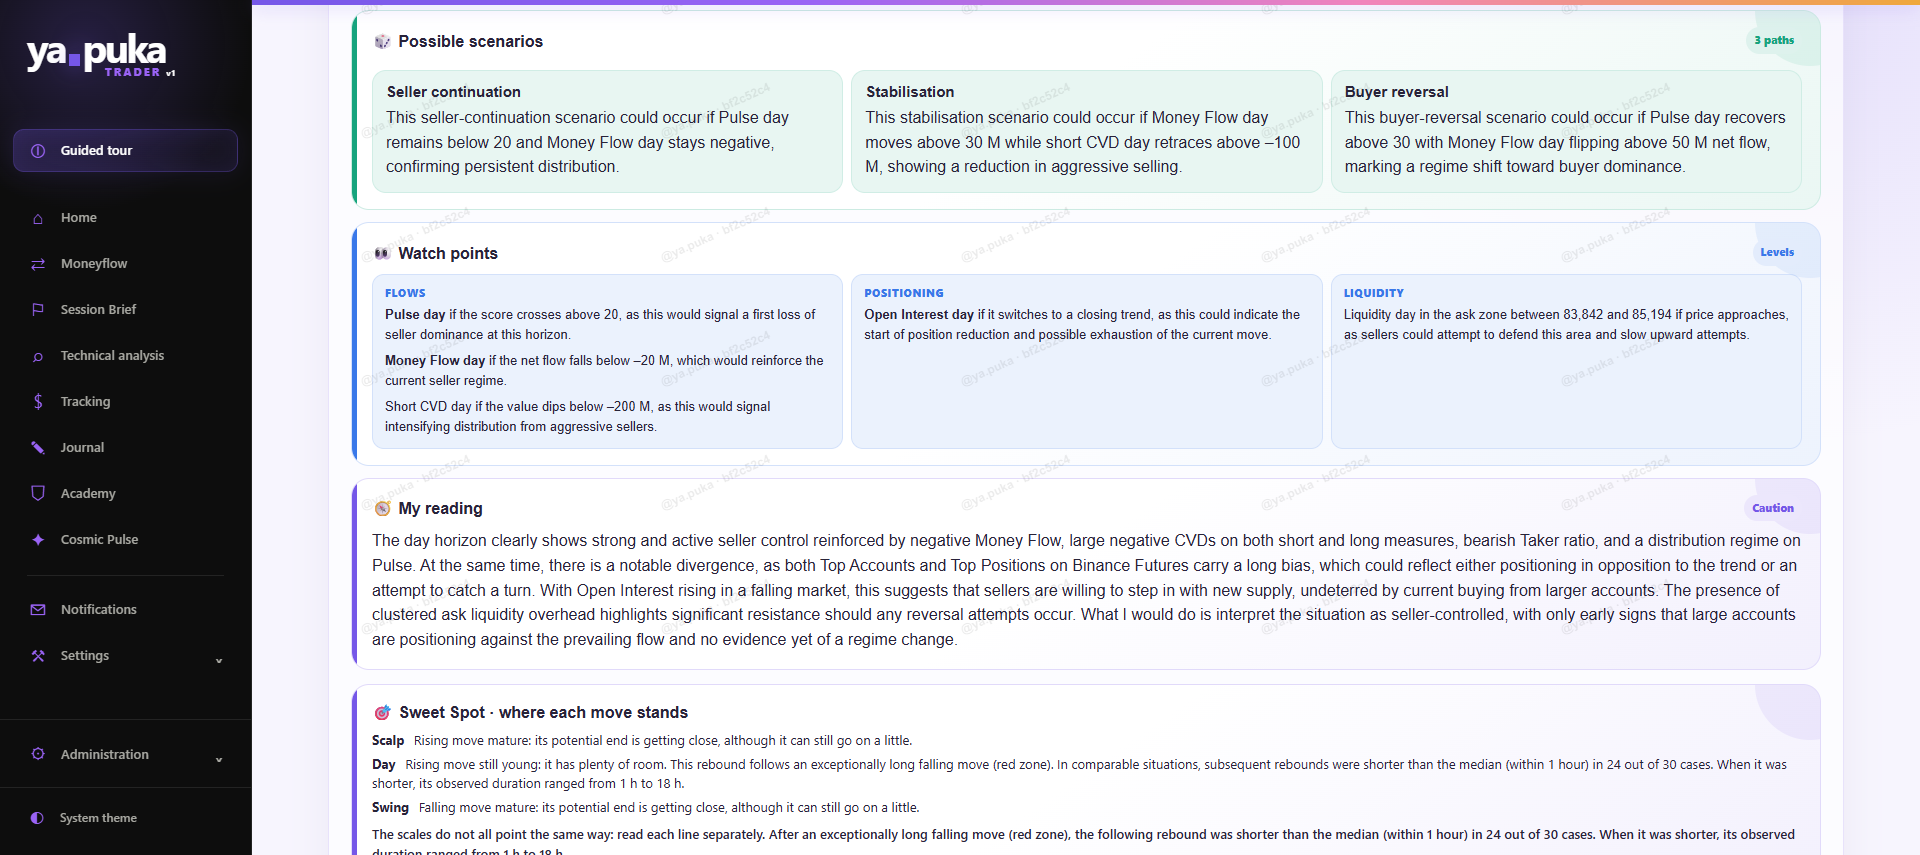
One-click analysis, with its scenarios and points to watch
You don’t stay alone in front of the numbers. Run an analysis: the AI reads the whole screen and answers in three parts. It uses your own AI account.
- The possible scenarios: what would have to happen for the decline to continue, the market to stabilise or reverse
- The points to watch: flows, positions and liquidity, with precise thresholds
- Its reading: what the AI concludes, in simple words
Find our analyst Stéphanie and the Yapuka videos on our YouTube channel. Subscribe to keep up with Yapuka between two analyses.
Watch the channel →Technical Analysis module
The Technical Analysis module:
an analyst, a filter, an AI
A Bitcoin chart can be read in a thousand ways, and most lead to a decision made too quickly. Here, the analysis always follows the same path, in three steps. You have nothing to redo: you enjoy the result.
Our analyst Stéphanie annotates the chart
On TradingView, our analyst draws by hand the supports, resistances, key zones and the structure of Bitcoin. A human eye decides what really matters.
A scoring filter checks
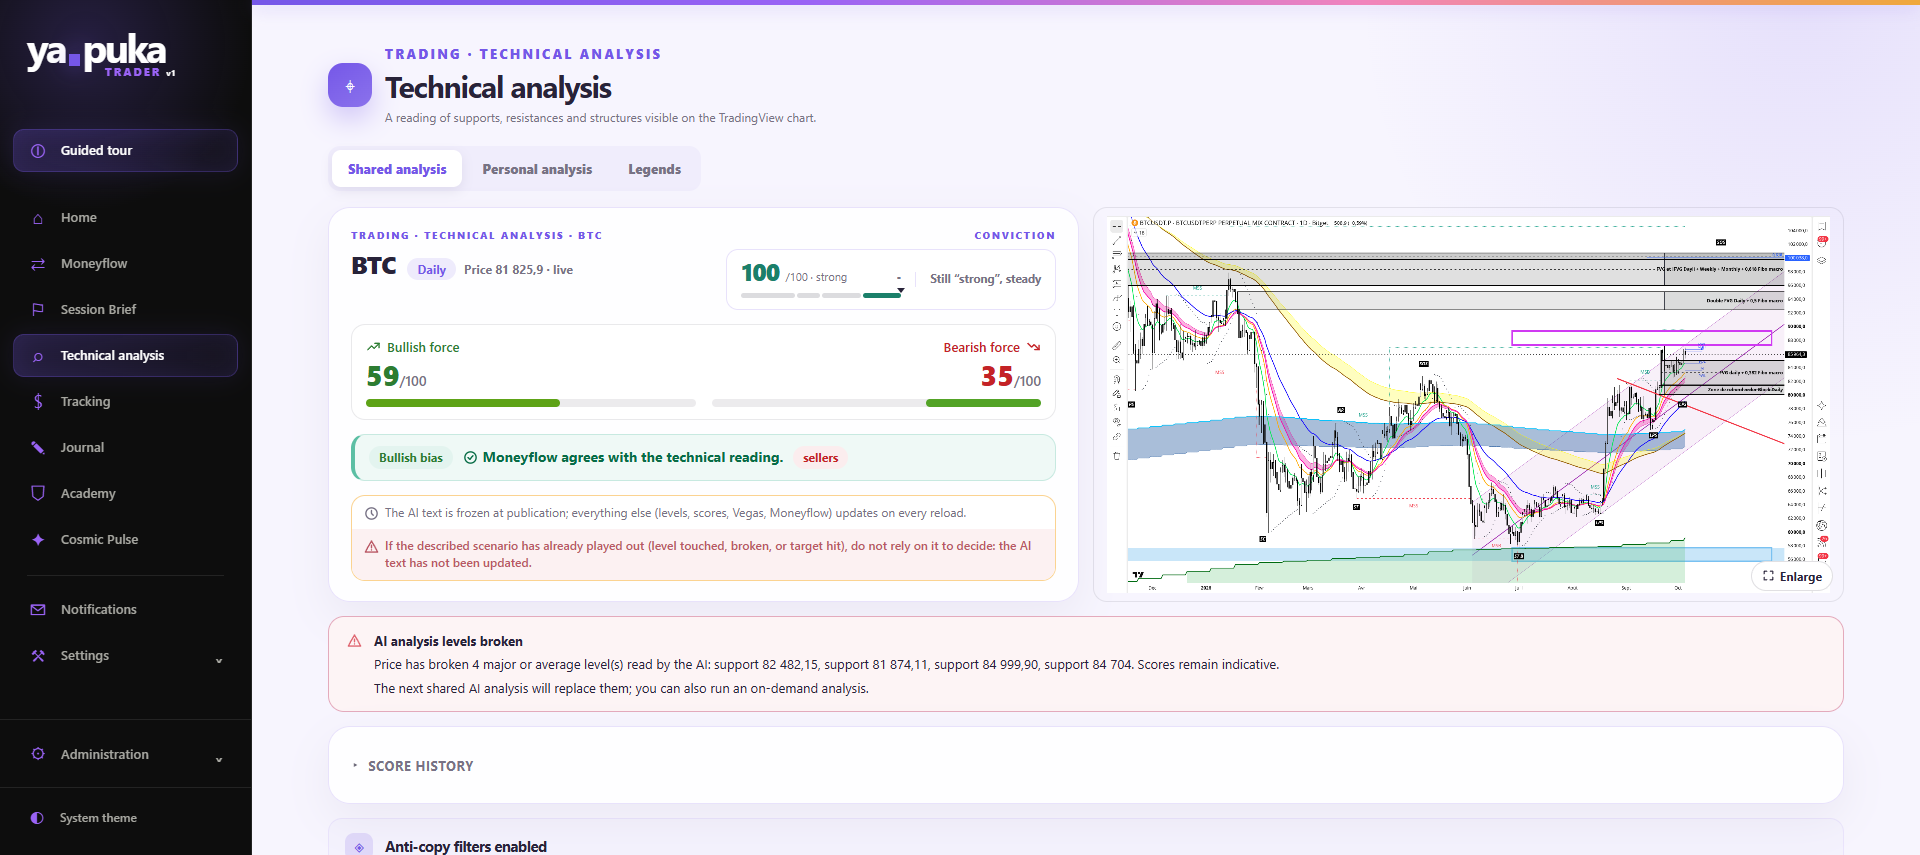
Each reading then receives a rating: Conviction score, buyer and seller strength, Vegas gauges. All of it is compared with the Moneyflow module, which warns you when it disagrees with the technicals.
The AI writes the analysis
From the annotated chart and its scores, the AI explains the situation in simple words: where the price is fragile, and what would bring the scenario down.
One shared analysis per week, at no extra cost
Every week, you receive our Bitcoin analysis, with its levels, scores and conclusion. Between two analyses, the scores update every time you open the page: you see at once whether the price has crossed a level.
- A Conviction score from 0 to 100, with its trend
- Buyer strength and seller strength, side by side
- An alert when a level cited by the AI has been crossed
- A warning when the described scenario has already played out
Have your own Bitcoin chart analysed
Got your own trade idea? Have the AI read it on your own BTC chart, whenever you want, without waiting for the weekly analysis. You use your own AI account, you stay in charge of the decision and you only pay for what you consume.
You need the TradingView Indicator Pack
The AI can’t see your screen: it reads data. Only our indicators supply it, in the right format, with the information it needs. Without the Pack, analysing your own chart is not possible.
The Pack is optional: everything else in Yapuka Trader works very well without it. Discover the Pack
Tracking module
The Tracking module:
what you don’t measure, you repeat
Most traders think they know how they trade. The numbers often tell another story. The Tracking module connects your accounts in read-only mode and gives you the truth about your results, without you having to copy everything over.
Your trades arrive on their own
Connect Hyperliquid with your public address, cTrader or TradeLocker, or import a CSV file. Yapuka sees your trades, but it can neither open nor close any, nor touch your money.
Compatible with:
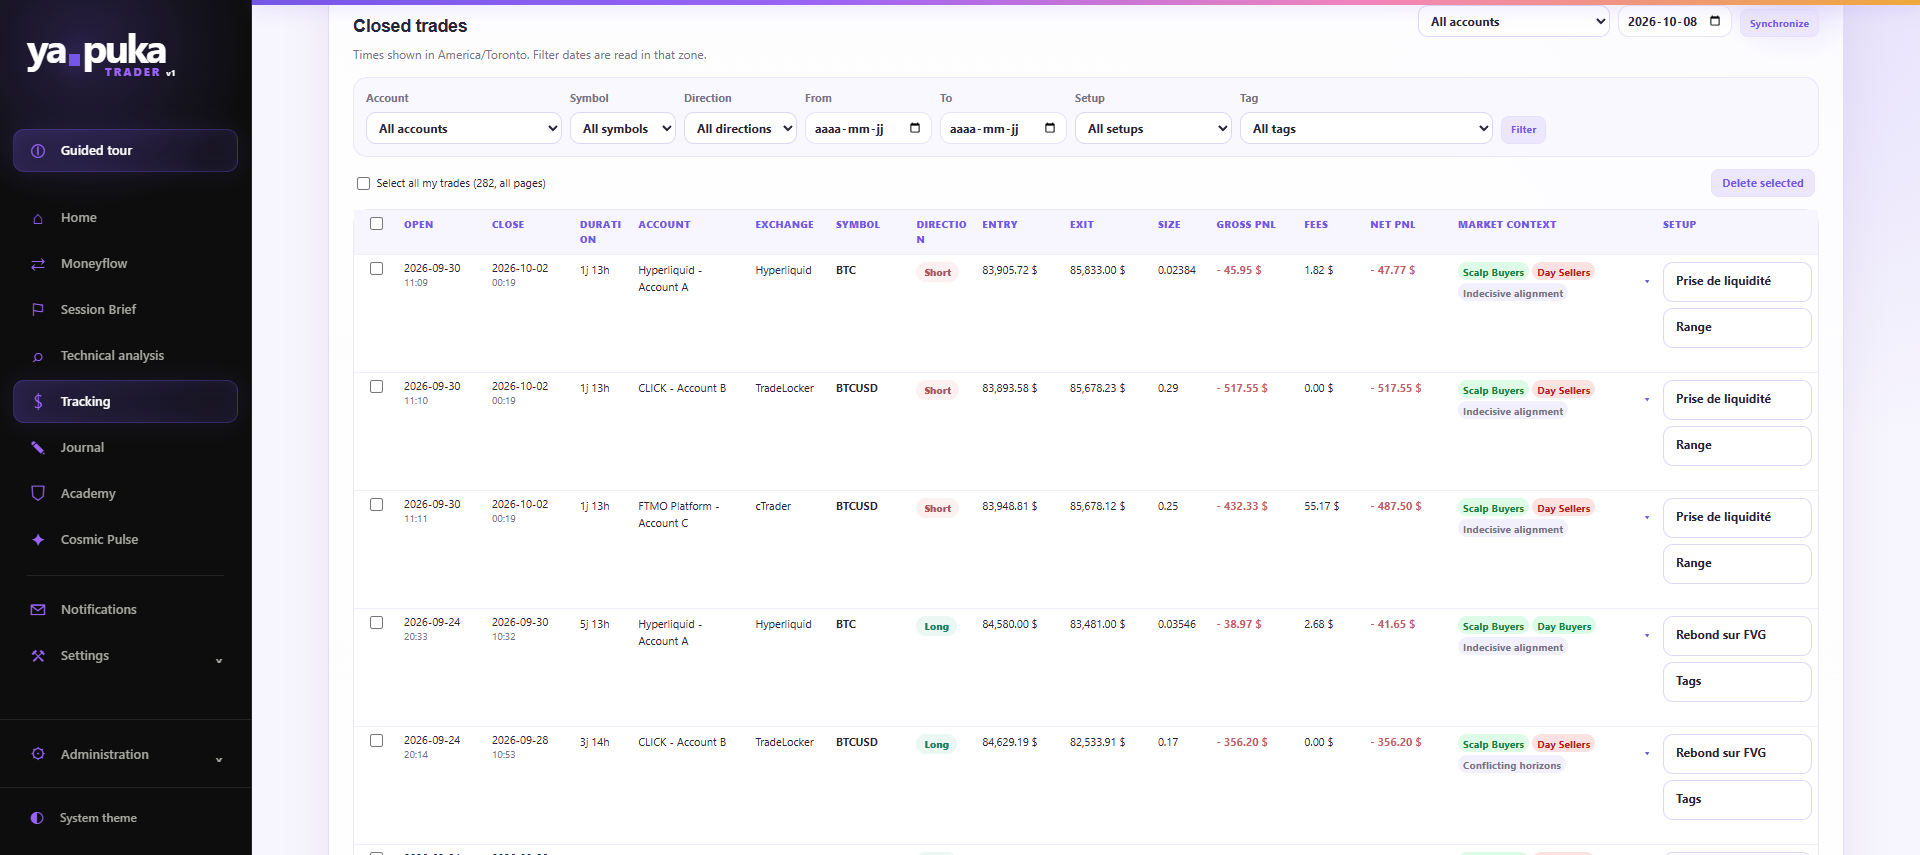
Every closed trade is filed with the market situation at the moment you opened it. You can also add your setup and your tags.
The statistics you receive, and why they matter
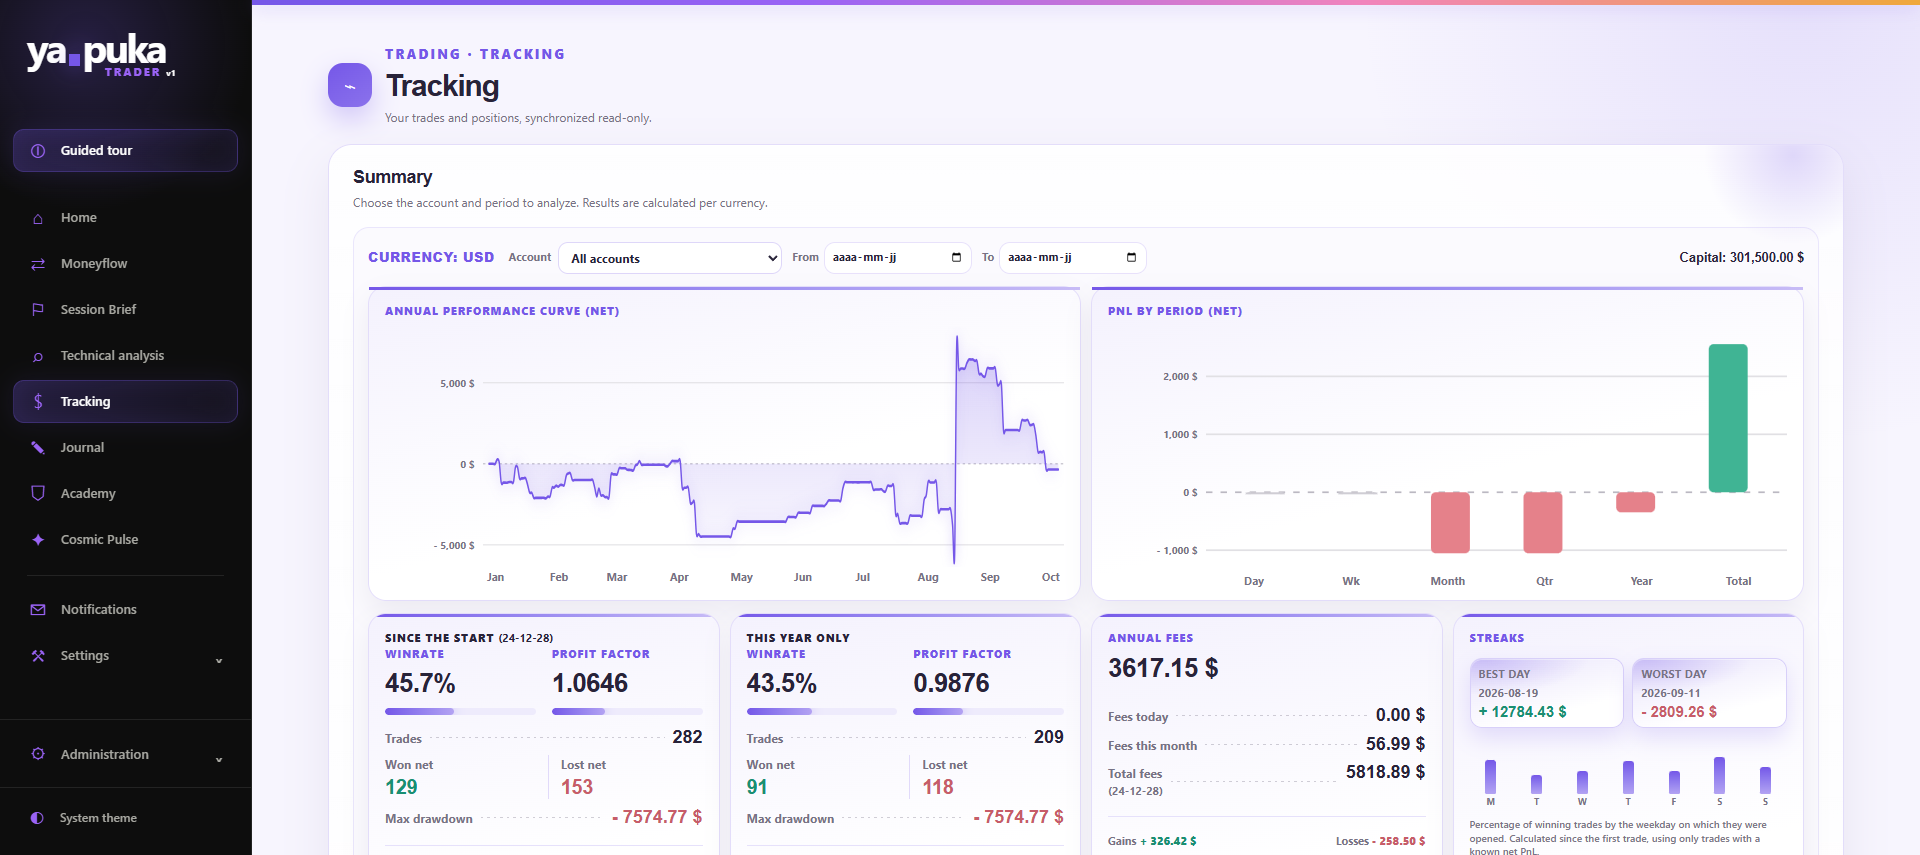
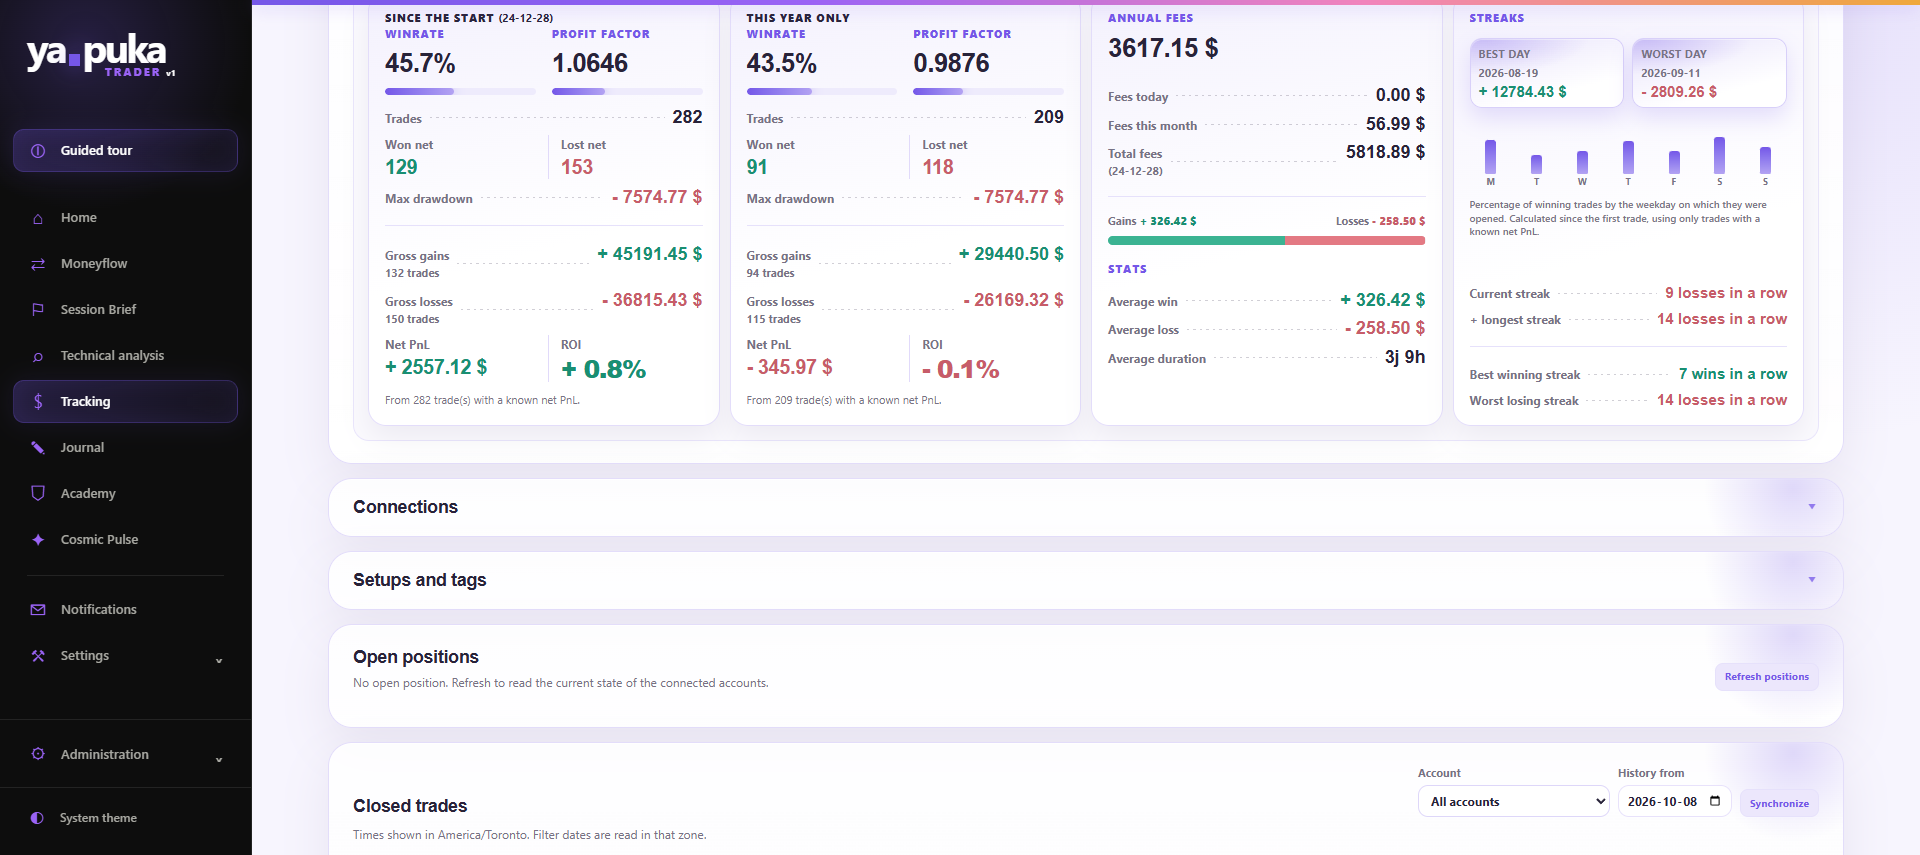
The share of your winning trades, since the start and over the year. On its own it can mislead: you can win often and still lose money.
What you win, divided by what you lose. Above 1, your method earns more than it costs.
The biggest fall in your capital. It shows what you really endured, not what you think you can endure.
Your fees for the day, the month and the year. They eat into a result silently, sometimes until they wipe out your edge.
Your best and your worst day, your winning and losing streaks. It’s the portrait of your consistency.
How your result evolves over the year, and your gains or losses by day, week, month and quarter.
Numbers, then answers
The Tracking module collects your data. The Journal module analyses it. Your statistics are used to spot your strengths and weaknesses, so that every trade teaches you something.
Your situation at a glance
Your current positions refresh on demand, across all your accounts at once. Your closed trades can be filtered by account, symbol, direction, setup or tag.
Journal module
The Journal module:
the mirror your broker will never show you
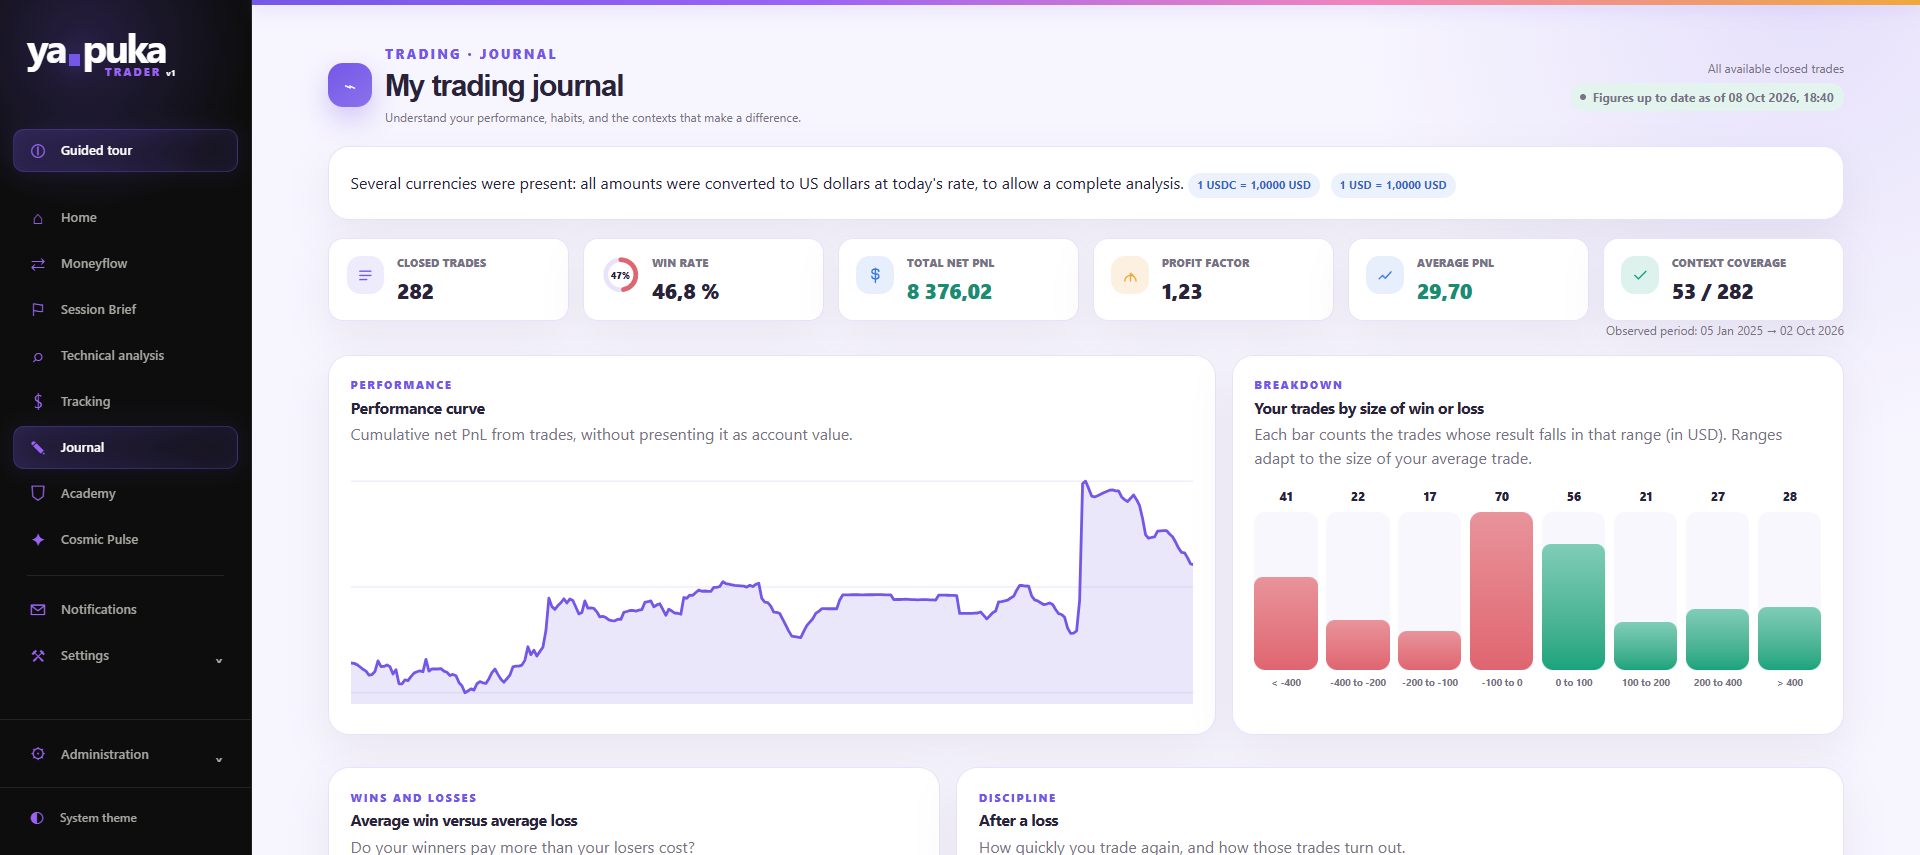
You don’t improve by trading more, but by understanding why you win and why you lose. The Journal module takes the trades synchronised by the Tracking module and turns them into a precise diagnosis of your strengths and weaknesses.
Finally find out what makes you win, and what costs you
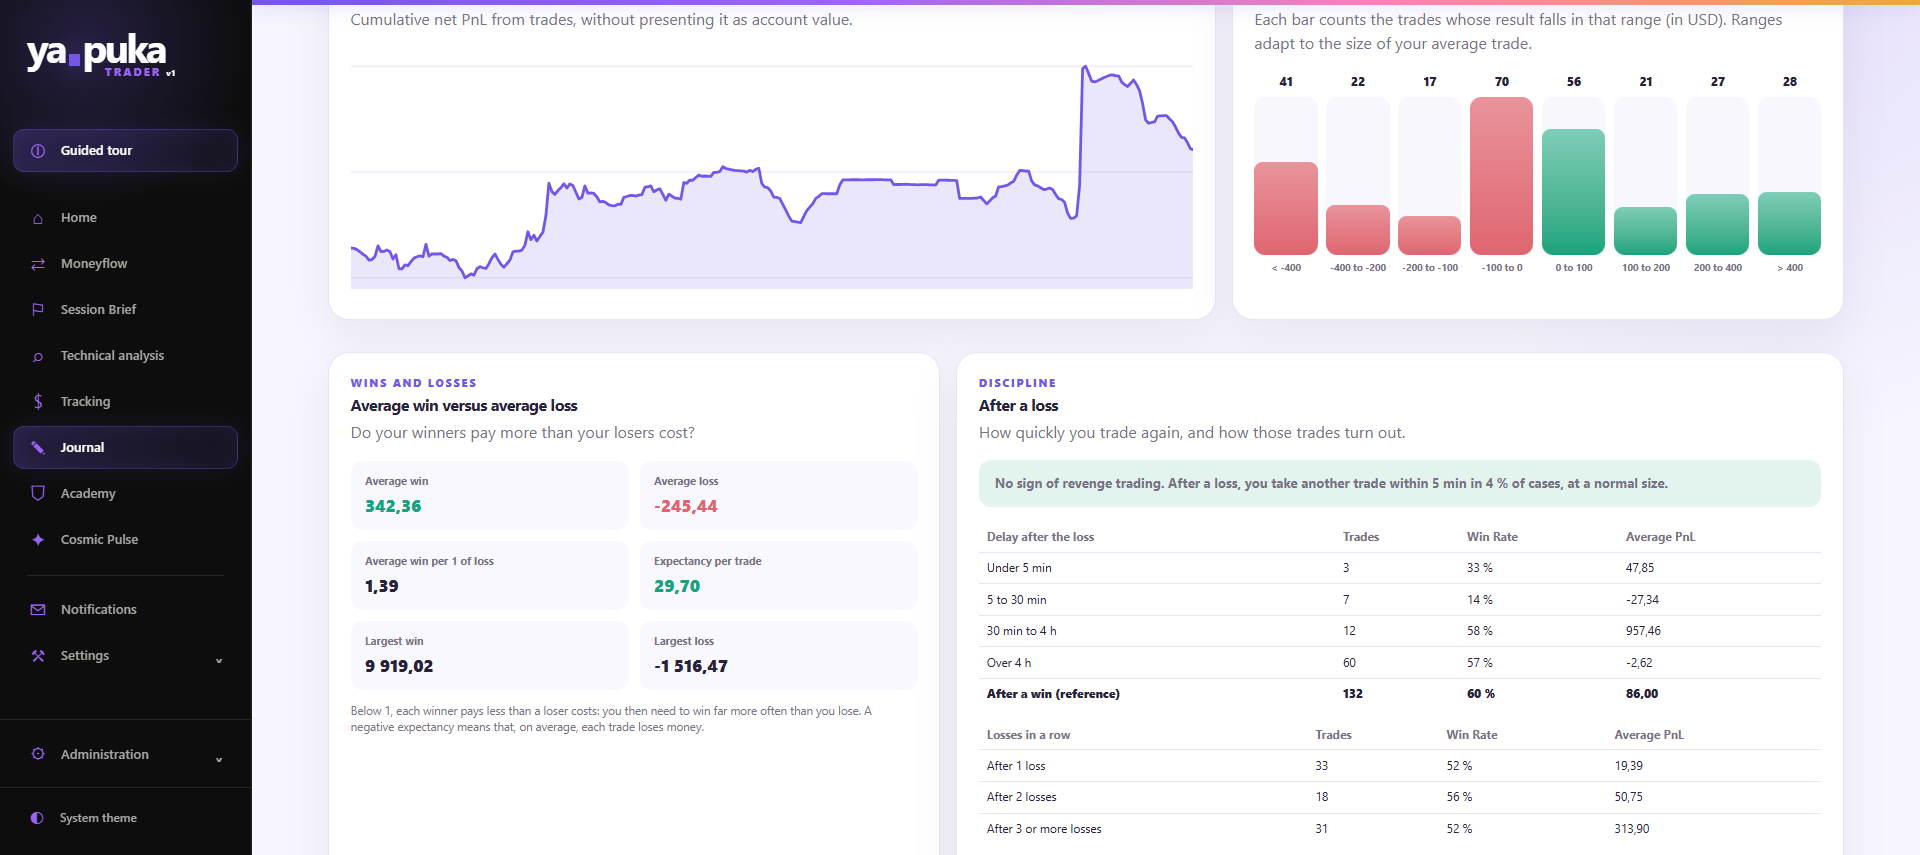
- Your result curve, and your trades ranked by size of gain or loss
- Your average gain against your average loss: do your winning trades pay for your losing ones?
- Your discipline after a loss: the module spots “revenge trading”, measures the time before your next trade and your results after one, two or three losses
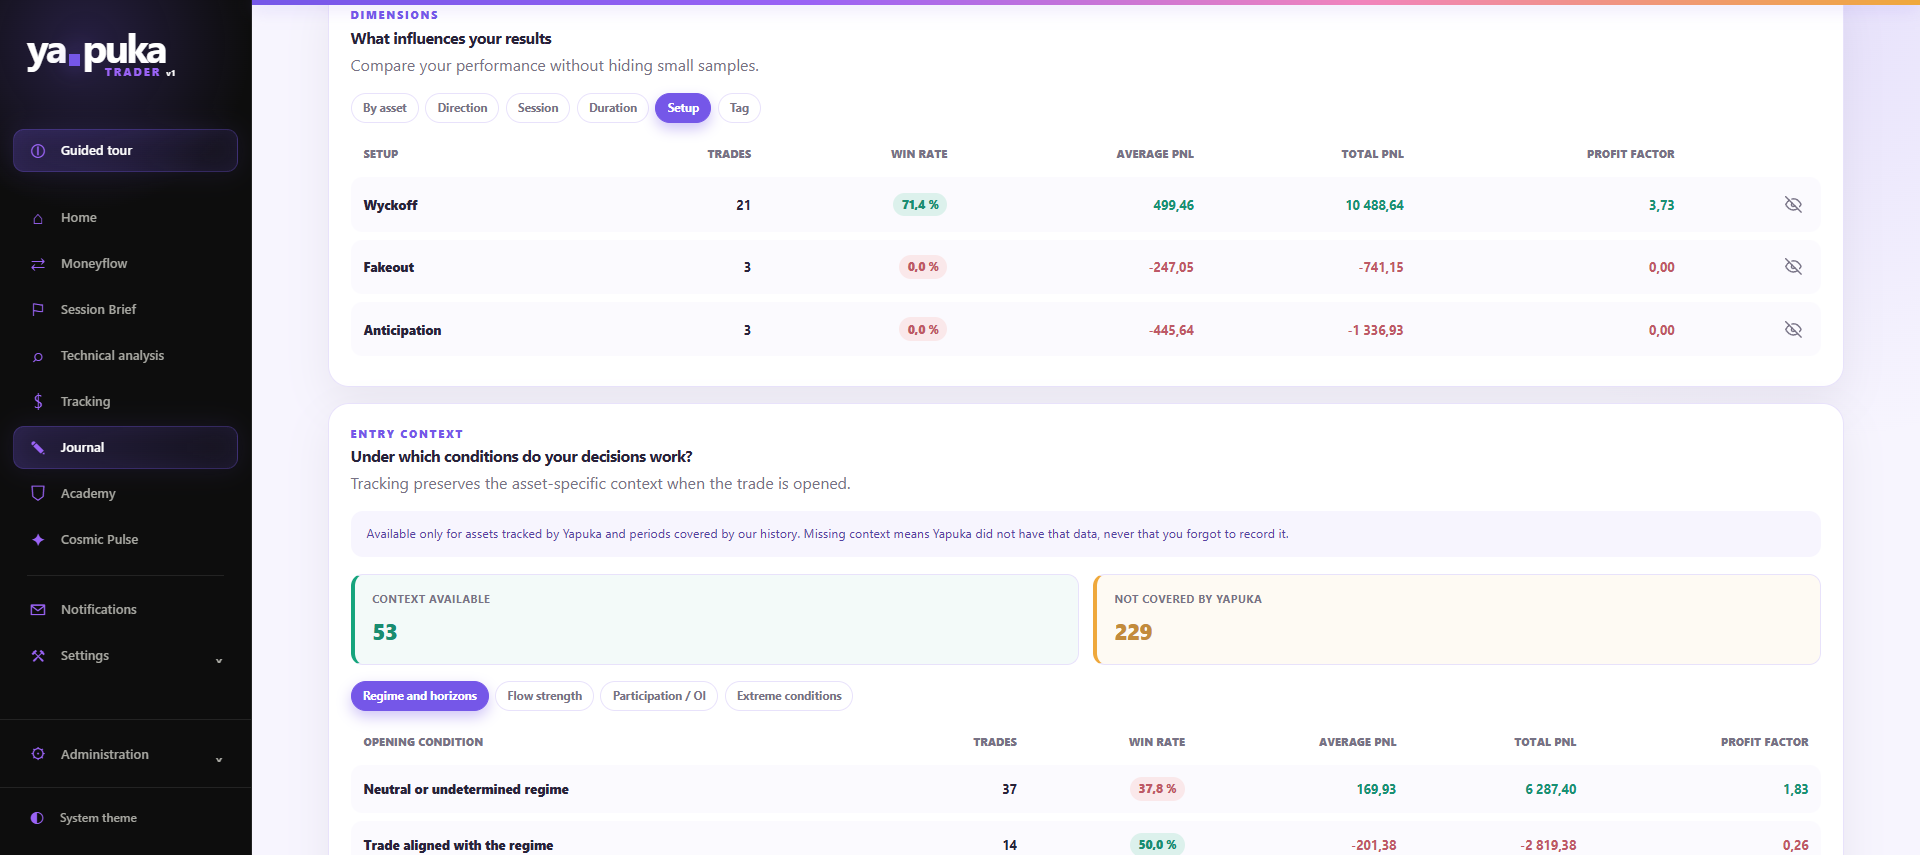
- Your results by asset, direction, session, duration, setup and tag
- The market conditions in which you decide well, or badly
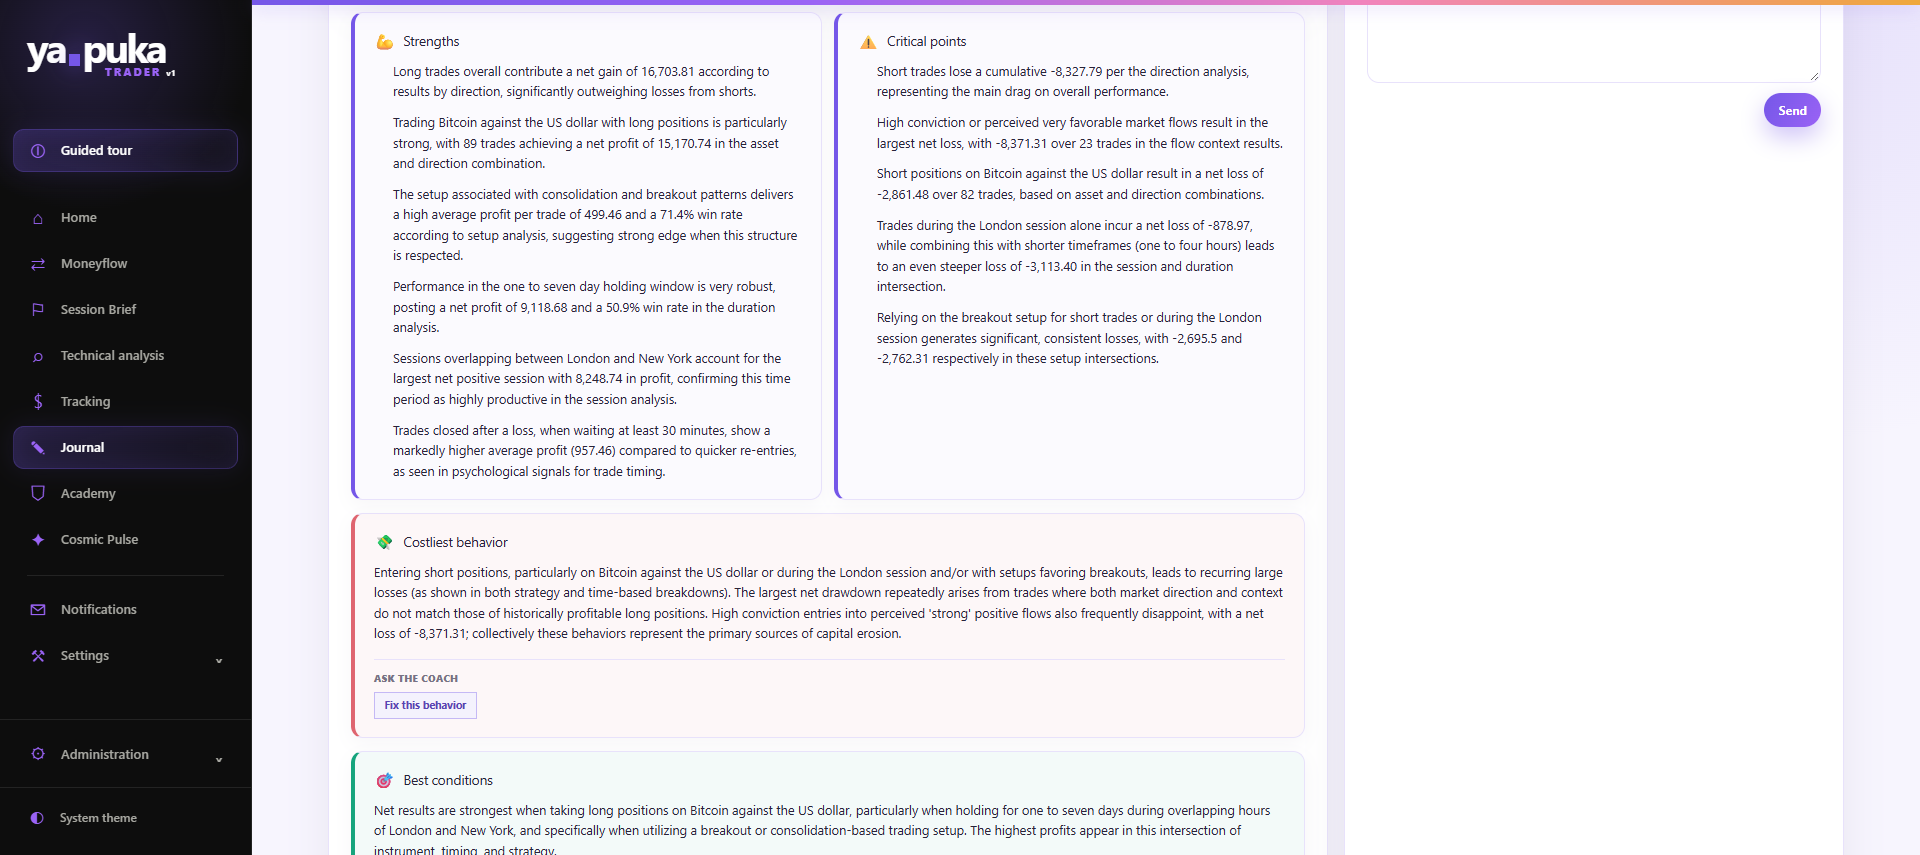
- A personal AI coach, using your own AI account, that analyses your trades and answers your questions with your numbers, not generalities
The whole Journal module page
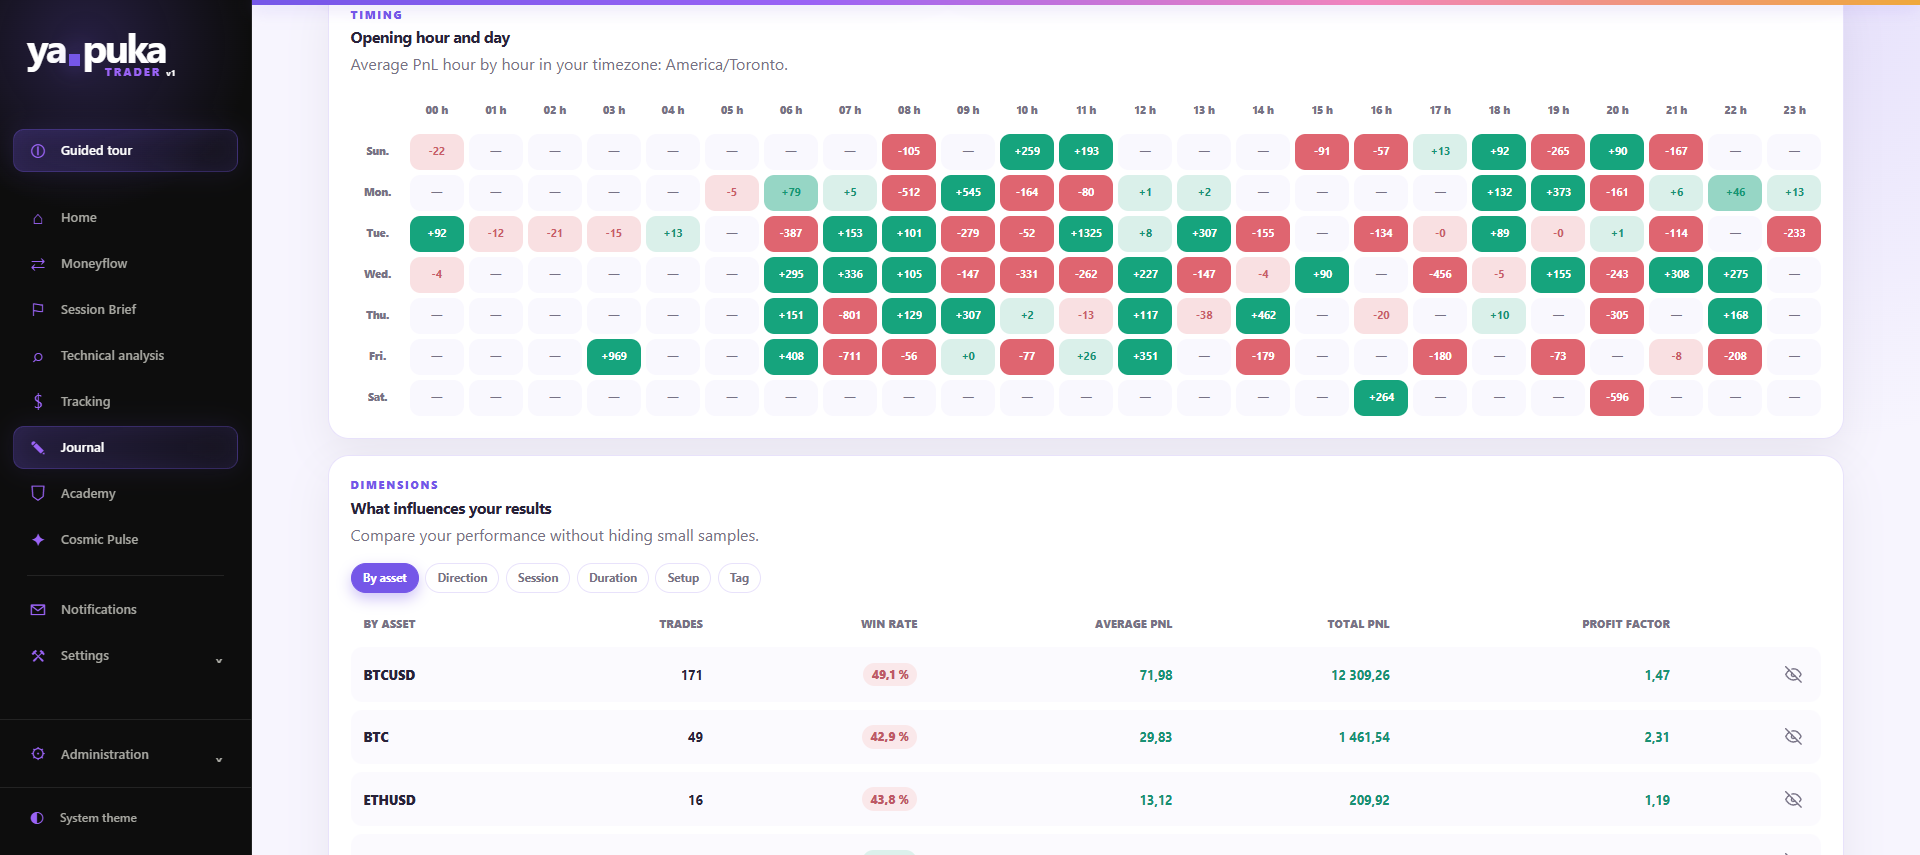
Your golden hours, and the hours to avoid
A map by hour and by day reveals when you win, and when you hand your gains back to the market. Then compare your results by asset, direction, session, duration, setup and tag.
A personal AI coach, connected to your own AI account, answers your questions about your own trades, with your numbers, not generalities.
The Yapuka YouTube channel is where you can follow our analyst Stéphanie and the Yapuka news, on top of everything you find in the Academy module.
Watch the channel →You are never alone
We hold your hand
Yapuka Trader is not a tool you are left to tame on your own. Every session open, every concept you haven’t mastered yet: everything is designed to support you, and everything is included in your subscription.
A brief at every market open, so you never show up unprepared
The Asian open
What the New York session left behind, and what Asia does with it: buyer pressure, seller pressure, funding and open positions.
The European relay
The brief is compared with Tokyo’s: what changed, what was absorbed, what remains to be confirmed.
The main session
The general context, options and expiries, compared with the Tokyo and London briefs to see whether the market is heading into a trap.
The briefs are waiting for you in the module, already written. You have nothing to request.
The Academy module: learn while you use the tool
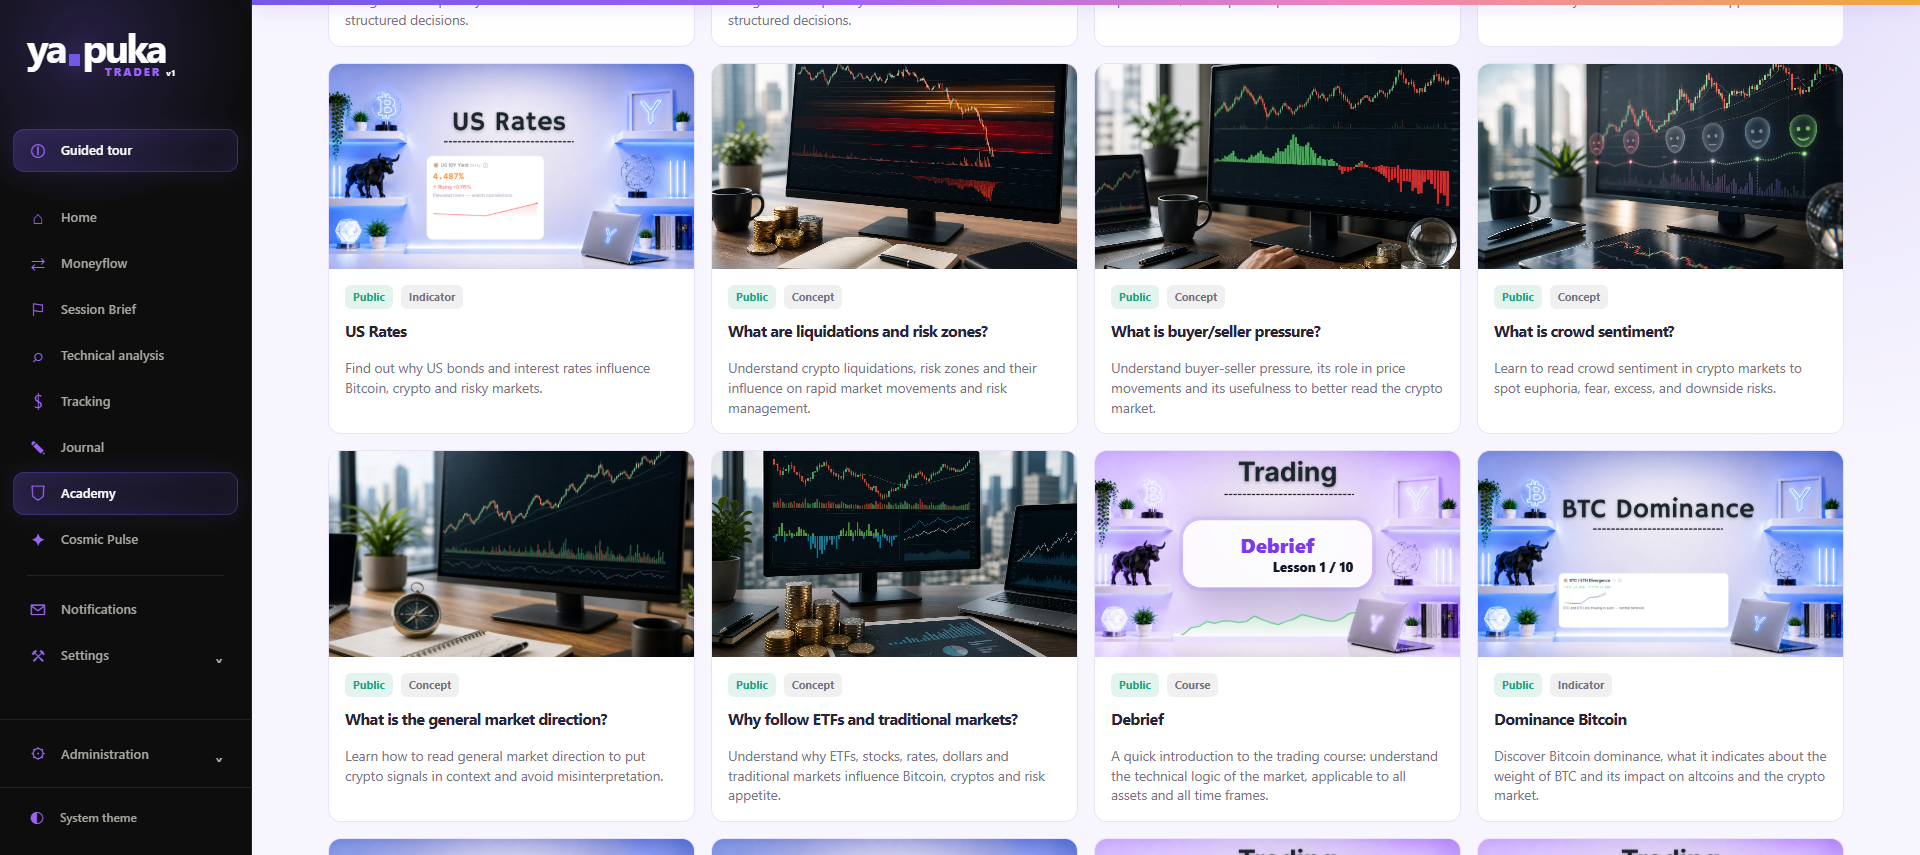
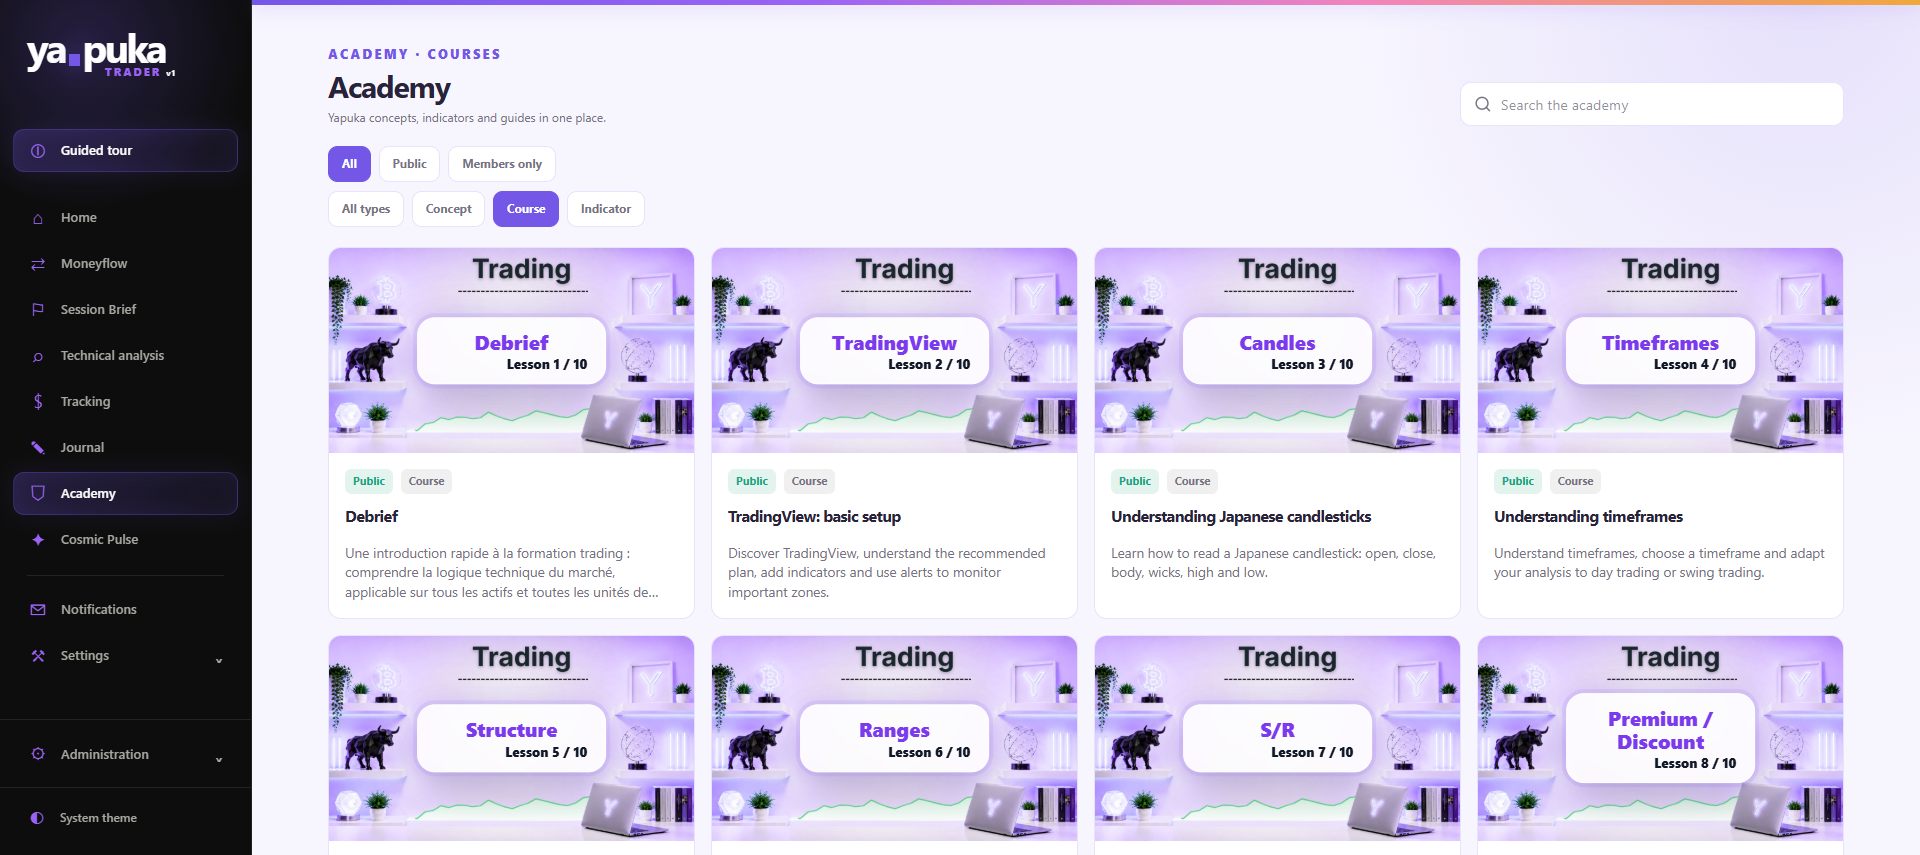
Every indicator you see has its own sheet, explained simply. The courses take you step by step from Japanese candlesticks to market structure, ranges, supports and resistances, then premium and discount zones. There are dozens of courses, concepts and indicator sheets, and the list keeps growing.
- Courses to follow in order, concepts to read when you need them, and indicator sheets
- A search to instantly find the word or indicator that escapes you
- Public content and members-only content
- A guided video tour, in your language, for your first steps
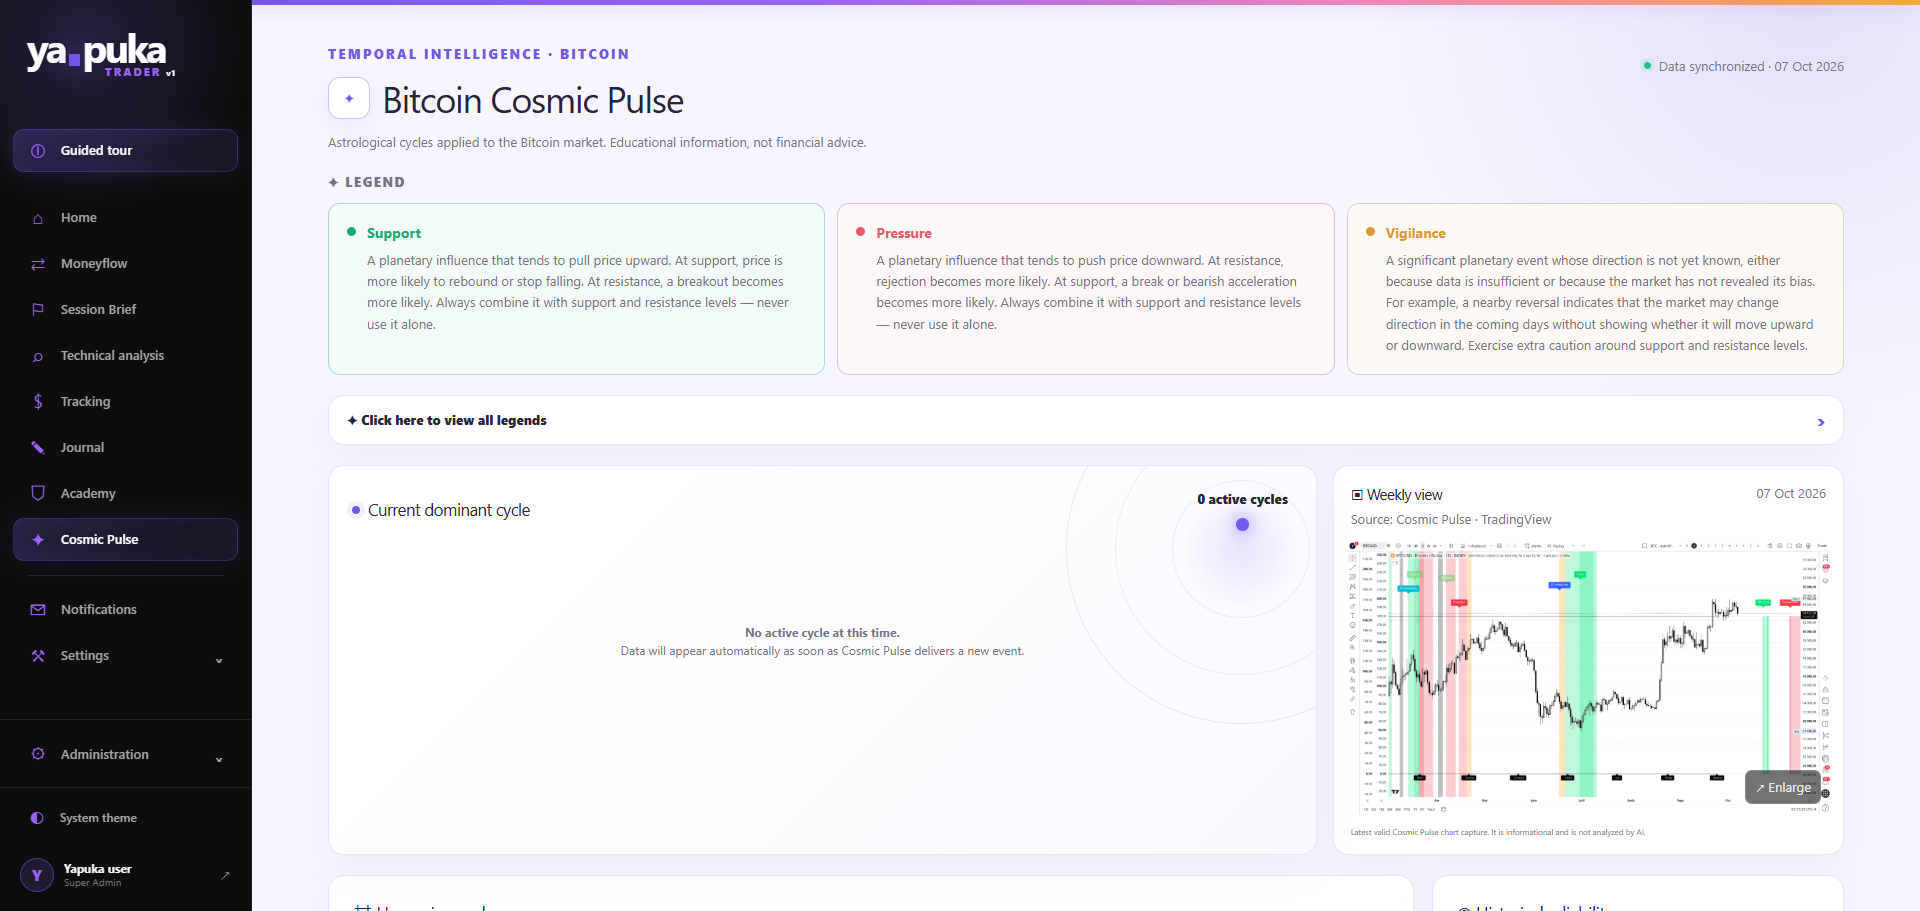
The Cosmic Pulse module: the view other traders don’t have
Planetary cycles applied to Bitcoin, with a simple code: Support, Pressure or Caution. You see the dominant cycle of the moment, as well as the week’s view on TradingView.
It is an educational and cultural reading, to be cross-checked with your supports and resistances. It is never financial advice.
Our analyst Stéphanie and the Yapuka videos are on the Yapuka YouTube channel. Come and subscribe.
Watch the channel →The TradingView Indicator Pack
Want to run your own analyses, on your own Bitcoin charts? The Pack is made for you. It is optional: your subscription works very well without it.
Yapuka indicators for your TradingView
A series of indicators to add to your chart. They display the useful information and prepare it for the AI.
Without data, the AI can’t analyse anything
Our indicators are designed to supply their information in the CSV format the AI needs. Without that information, it cannot analyse your chart.
Your analyses, when you decide
Have your Bitcoin chart analysed at any moment, with your own AI account, without waiting for the weekly analysis.
Every new indicator we create joins your Pack for free.
Artificial intelligence
Your AI, your key, your bill
At Yapuka, AI isn’t locked inside a plan of credits that run out. You choose your provider, plug it in once, and pay directly for what you use, with no markup from us.
Coming soon: Yapuka will develop an MCP, a direct connection that will let you link your AI plan as it is, without going through an API key. Find this on the roadmap, at the bottom of the page.
Create a key with your provider
It only takes a few minutes, and we give you a detailed tutorial to guide you.
Paste it in your settings
Just once, for all the modules.
Run an analysis whenever you want
Only when you ask, never without your consent.
Who it’s for
A tool that adapts to your level
You’re just starting out
Every indicator is explained, every reading is written in plain language, and the Academy module guides you. You no longer have to guess what the numbers mean.
You already trade
The Tracking and Journal modules show you your real results, your bad hours and your reflexes after a loss. It’s the fastest way to fix what costs you.
You want to go deep
Options, GEX, DEX, max pain by expiry, liquidity and divergences: a layer of information you won’t find in a simple chart.
Pricing
One subscription, everything’s in it
This price is reserved for the first 50 customers. You keep it for as long as your subscription stays active. If you ever stop it, this price disappears: if you subscribe again later, you will pay the regular price of $29.99.
- The full Moneyflow module, with the Sweet Spot and options
- The Technical Analysis module: one shared analysis per week
- The Tracking and Journal modules, with the AI coach
- The Session Brief, Cosmic Pulse and Academy modules, and the guided tour
- An interface in 5 languages, for swing trading on Bitcoin
- Follow our analyst Stéphanie and the Yapuka videos on the Yapuka YouTube channel
TradingView Indicator Pack
A single payment of $197, access for life, and new indicators included at no cost. It is required to have your own charts analysed.
Good to know
- Taxes are added depending on your country
- AI is paid with your own key
- Cancel any time from your account
- Secure payment by Stripe
- A single account for all Yapuka products (Yapuka Holder and Yapuka Invest: coming soon)
Questions
What people often ask us
Does Yapuka Trader tell me what to buy or sell?
No. The tool shows the state of the market and your own statistics. Decisions remain yours, and nothing displayed is investment advice.
On which assets, and for what trading style?
Swing trading, on Bitcoin only. There are no scalping or intraday signals, and no other assets.
Can it place orders for me?
No. The tracking connections are read-only: Yapuka sees your trades, but can neither open nor close any.
Do I need the TradingView Pack to use Yapuka Trader?
No. It is used to have your own charts analysed by the AI. The weekly shared analysis is included in the subscription.
Is AI included in the subscription?
The AI features use your own key with Anthropic, OpenAI or xAI. You pay your usage directly to that provider.
Where can I follow Yapuka?
On the Yapuka YouTube channel, where you will also find our analyst Stéphanie.
Can I cancel?
Yes, at any time from your account. For the launch offer, cancelling means losing the launch price.
Roadmap
What’s coming to Yapuka
Yapuka moves forward in stages. Hover over a point to read the explanation. The years shown are targets: they may change.
- Goal late 2026 – early 2027Yapuka Holder
Long-term tracking for those who hold their positions, with the same Yapuka account.
- 2027 goalYapuka Invest
Trading on other asset classes: stocks, indices, forex and commodities.
- Delivered · TraderThe Sweet Spot
How long Bitcoin's move has lasted compared with its history, over three time scales.
- Delivered · TraderMax pain by expiry
The price that costs option sellers the least, expiry after expiry.
- Delivered · TraderAI Coach for the Journal
An analysis of your strengths and weaknesses, and a chat about your trades.
- Delivered · TraderMulti-setup Tracking
Several setups and tags on each trade, to analyse your results better.
- 2026 goal · TraderFinishing the Academy
Completing the courses, concepts and indicator sheets of the Academy module.
- 2026 goalTwitter publishing module
A module to publish directly to Twitter.
- 2027 goal · TraderJournal export to PDF
Export your journal results to PDF to keep, print or share them.
- 2027 goal · TraderImproved Journal
New improvements to the Journal module, to better understand your strengths and weaknesses.
- 2027 goal · TraderSharing statistics
Share the statistics of your Tracking module with other people.
- 2027 goal · TraderImproved overall analyses
More precise, clearer and more complete overall analyses.
- 2027 goal · AINew AI models
More AI models to choose from for your analyses.
- 2027 goal · TraderMoneyflow indicator monitoring
The Moneyflow module's indicators are monitored continuously and adjusted when needed.
- 2027 goal · TraderDynamic explanatory texts
Explanatory texts that are clearer and better adapted to the market situation.
- 2027 goal · TraderSmart Liquidity monitoring
The Smart Liquidity card is monitored and optimised when needed.
- 2027 goalWhite Label plan
An offer to share Yapuka analyses with your own community.
- 2027 goalLive statistics page
A page that shows Yapuka's statistics live.
- 2027 goal · New moduleEconomic announcements analysis
A module that analyses economic announcements and their possible effect on the market.
- 2027 goal · TraderCosmic Pulse statistics
Update of the Cosmic Pulse module's statistics.
- 2027 Goal · TraderMissing Translations
Make Spanish, Portuguese, and German fully operational.
- Late 2027 – early 2028MCP module for your AI plan
An MCP module to connect Yapuka directly to your AI plan, without going through an API key.
- Late 2027 – early 2028Affiliate Program
Earn money by referring your friends to us.
- 2028 · Subject to conditionsStrategy sharing and trading bot
Share strategies and build a bot for automated trading, provided its success rate is above 50%.
Solid line: available or planned. Dashed line: an idea under study, no commitment.
“Delivered”: already in your subscription. “In progress”: under construction. A year: the launch target. A dashed line: an idea under study, with no commitment to a date.
Yapuka moves forward step by step, and you can follow it on the Yapuka YouTube channel, together with our analyst Stéphanie.
Watch the channel →Yapuka Trader is an information and analysis tool. It does not constitute financial advice. Trading crypto-assets carries a high risk of capital loss. Past performance is no guarantee of future results.
See the market as it is,
not as they tell you it is
Join the first 50 customers and keep the launch price for as long as you stay subscribed.