Yapuka Trader
You do not need more information.
You need the right information.
Your intelligent dashboard
One screen.
One analysis.
One question: what is really happening in the market?
Yapuka Trader automatically brings together the most important data and turns it into simple, easy-to-understand explanations.
You immediately know:
- where money is entering or leaving
- whether investors are too optimistic or too pessimistic
- whether institutions are buying or distributing
- whether a move is becoming risky
- whether a reversal is becoming likely
AI that speaks your language
You do not need to be a professional trader.
Our artificial intelligence automatically translates complex data into clear language.
Instead of seeing:
You get:
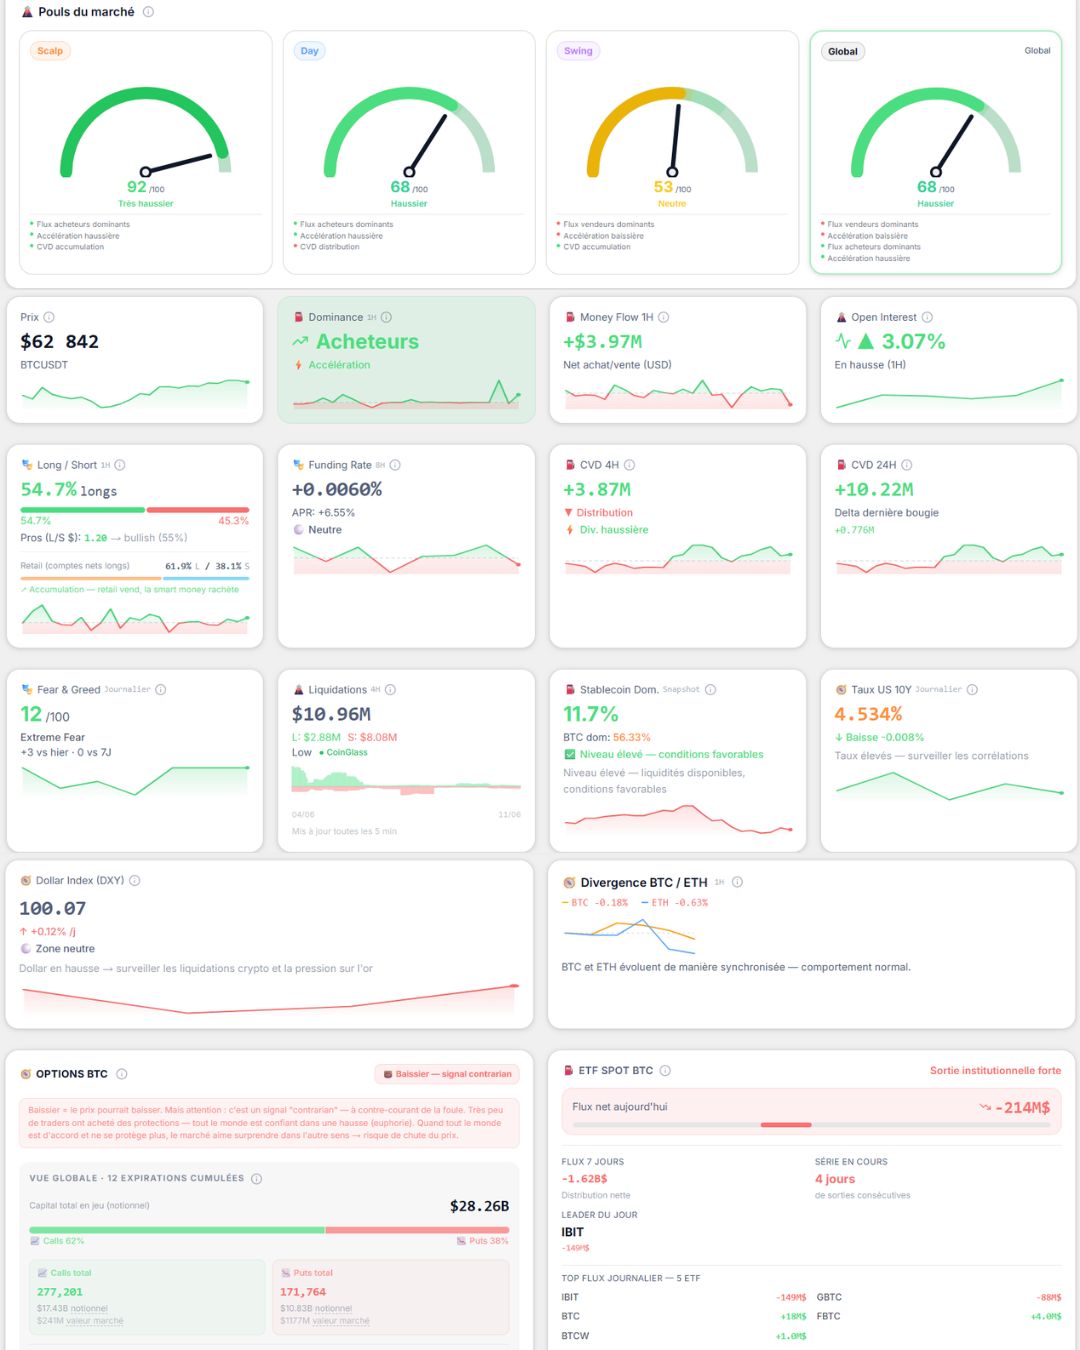
All important information in one place
No need to open 15 different websites. Yapuka Trader automatically monitors:
Yapuka Trader centralizes the main indicators used by investors:
All this information is automatically analyzed by artificial intelligence, which turns it into simple, understandable explanations, then combines it with our support and resistance map to help you quickly understand what is happening and make decisions more calmly.
You do not just see numbers: you understand where the market stands, why a zone is important, and which factors are truly influencing its movement.
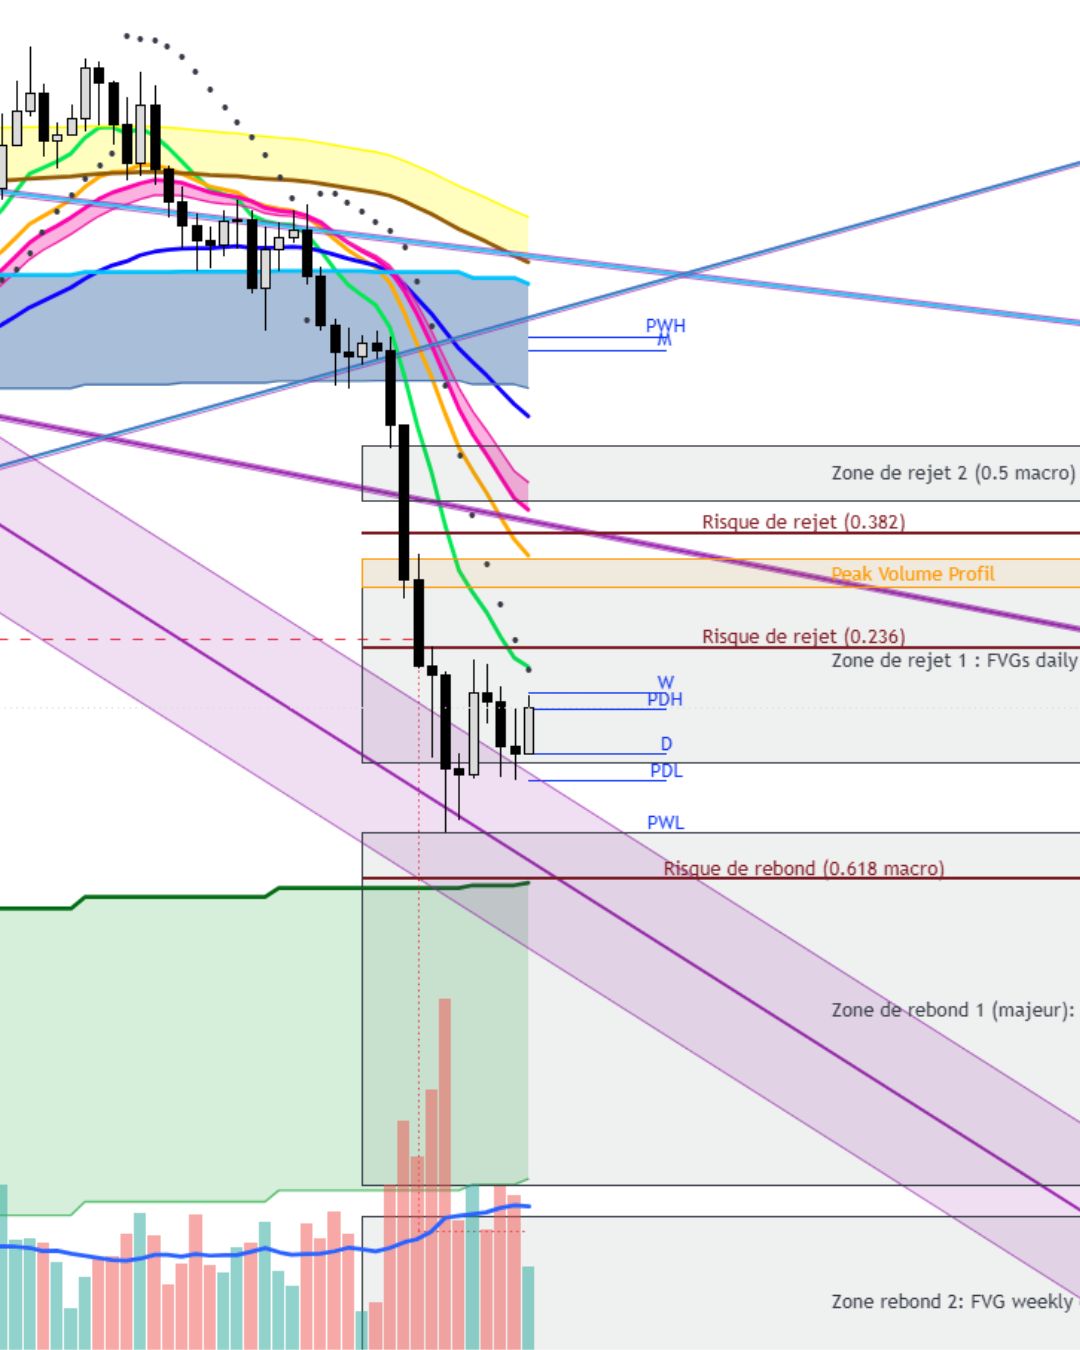
Your support and resistance map
Markets do not rise and fall randomly. Some levels naturally attract buyers or sellers and can trigger a bounce, a slowdown, or a trend reversal. Yapuka Trader automatically groups these supports and resistances on one clear, easy-to-read map, so you can immediately see the zones that deserve your attention.
Each zone comes with a simple explanation that helps you understand why it matters.
✔ Potential bounce zone
✔ Major resistance
✔ Confluence of several indicators
✔ Level watched by many investors
You are no longer just looking at lines on a chart: you understand their role in the market context.
A support or resistance zone indicates where the market could react. Money Flow reveals the real strength of buyers and sellers at that moment. By automatically combining these two analyses, our artificial intelligence estimates whether price is more likely to bounce, be rejected, or break through the level with conviction.
Do not just follow. Understand.
Yapuka Trader is designed to guide you, not to make you dependent on software.
That is why every subscription includes complete training that teaches you how to identify and draw supports, resistances, and the main technical zones of the market yourself. You progressively understand what you see and gain autonomy with every analysis.
And if you want to go even further, you can also use our TradingView toolkit. It brings together the same indicators and the same methodology as Yapuka Trader to analyze any chart, on any asset, and on any timeframe.
Our goal is simple: give you the tools to understand the market by yourself, with a clear, educational method that is easy to apply.
Who is it for?
Beginners
You want to understand the market without learning dozens of indicators.
Active investors
You want to save time and take a step back before every decision.
Traders
You want a quick overview before analyzing your charts.
Ready to trade more simply?
Designed by an investor, for investors.
Join us, Yapuka Trader!