Datas
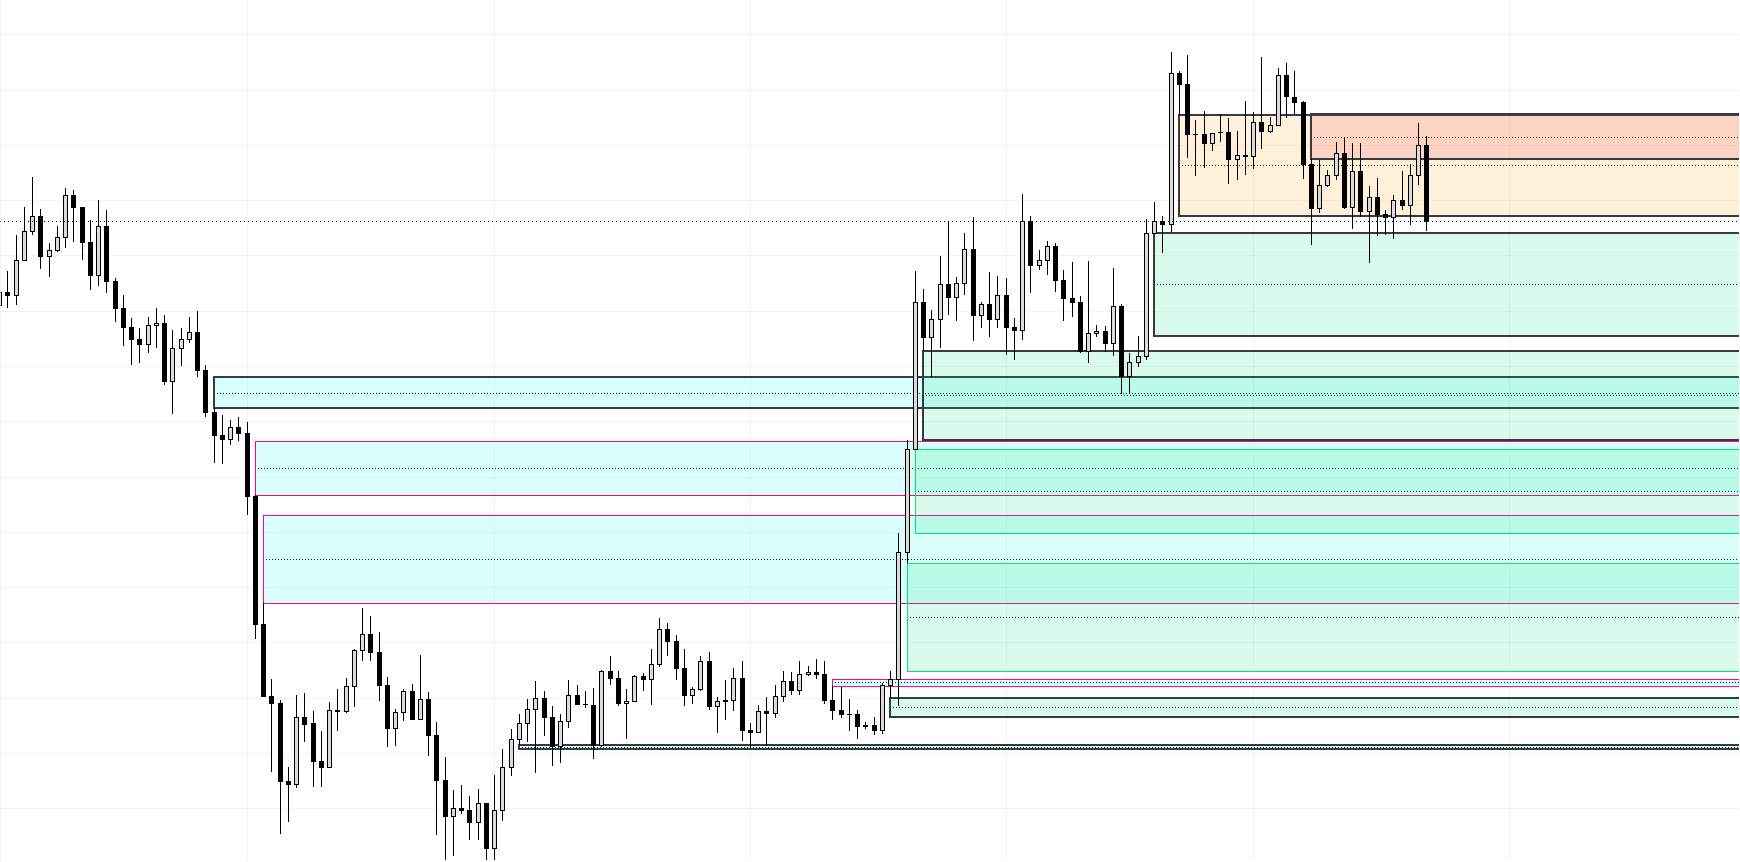
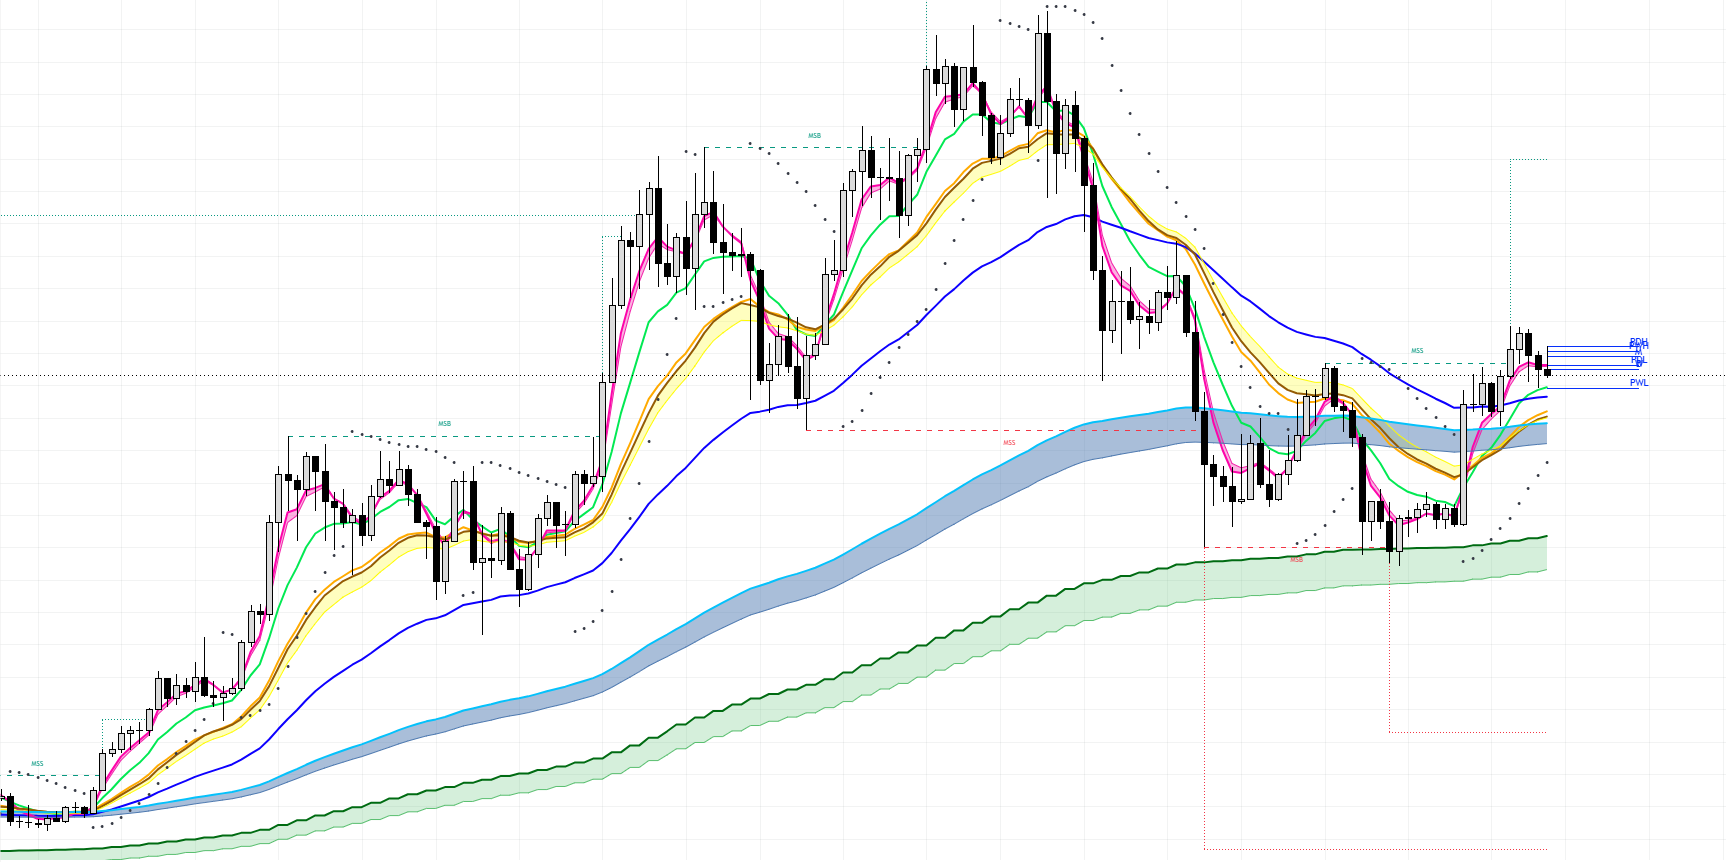
This is the heart of Ya.puka. Datas displays the Vegas on your chart: four price bands, each calculated over a different period (4 hours, 1 day, 1 week…). They are major reference points around which price often reacts.
The Vegas tell you a huge amount at once. Think of them as a map of the market: where it stands, where it’s heading and where it may turn around.
What the Vegas tell you
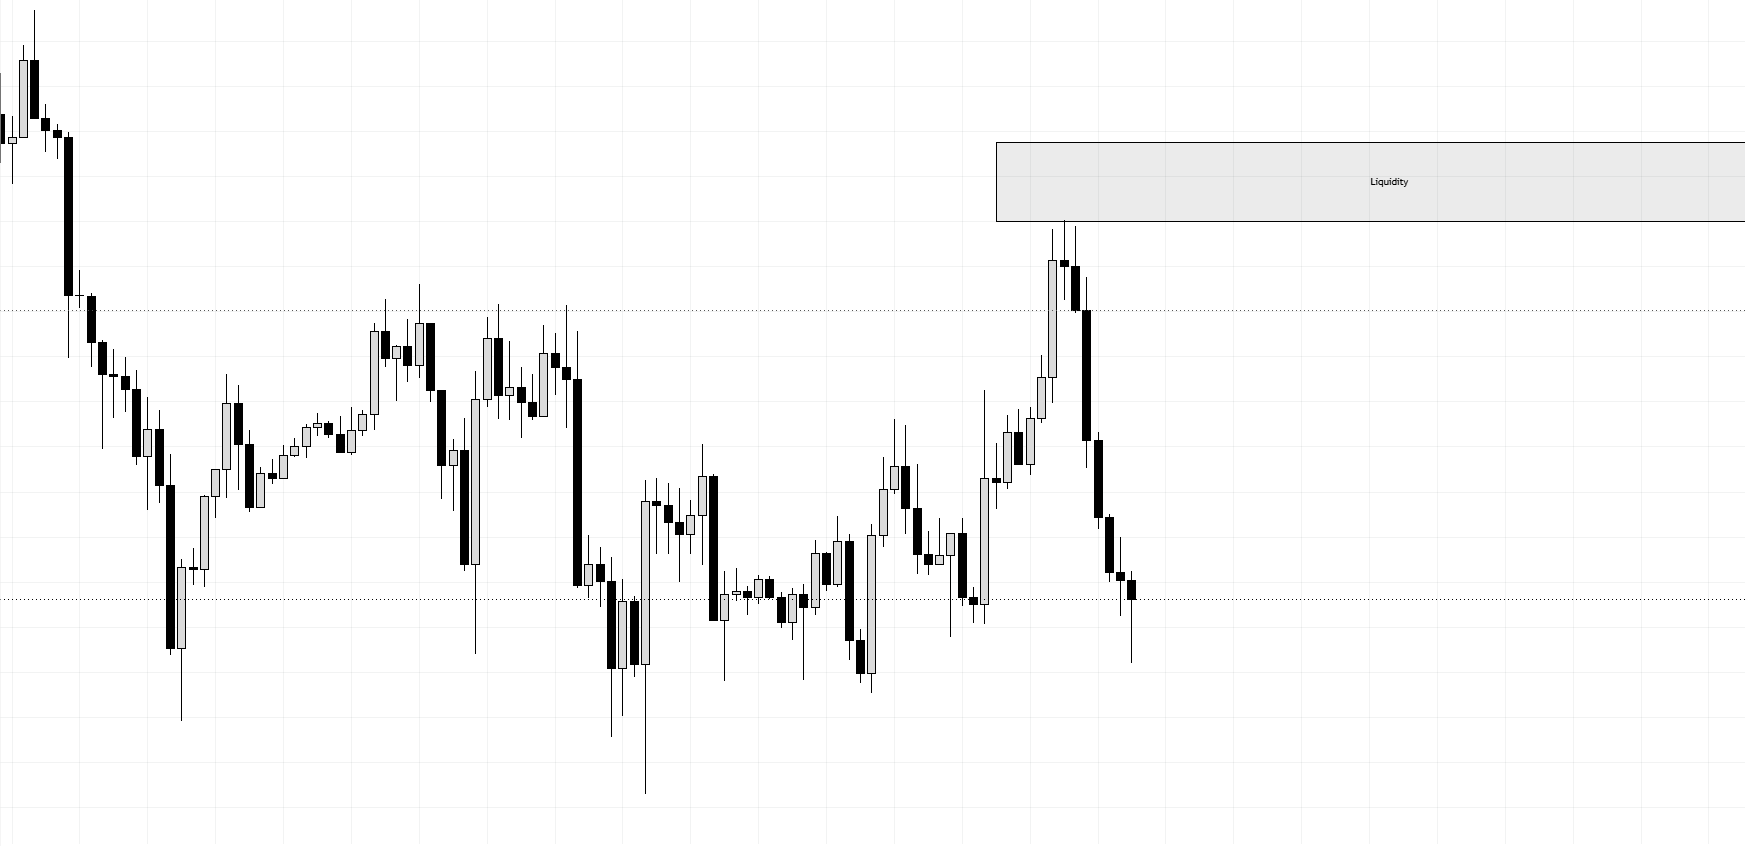
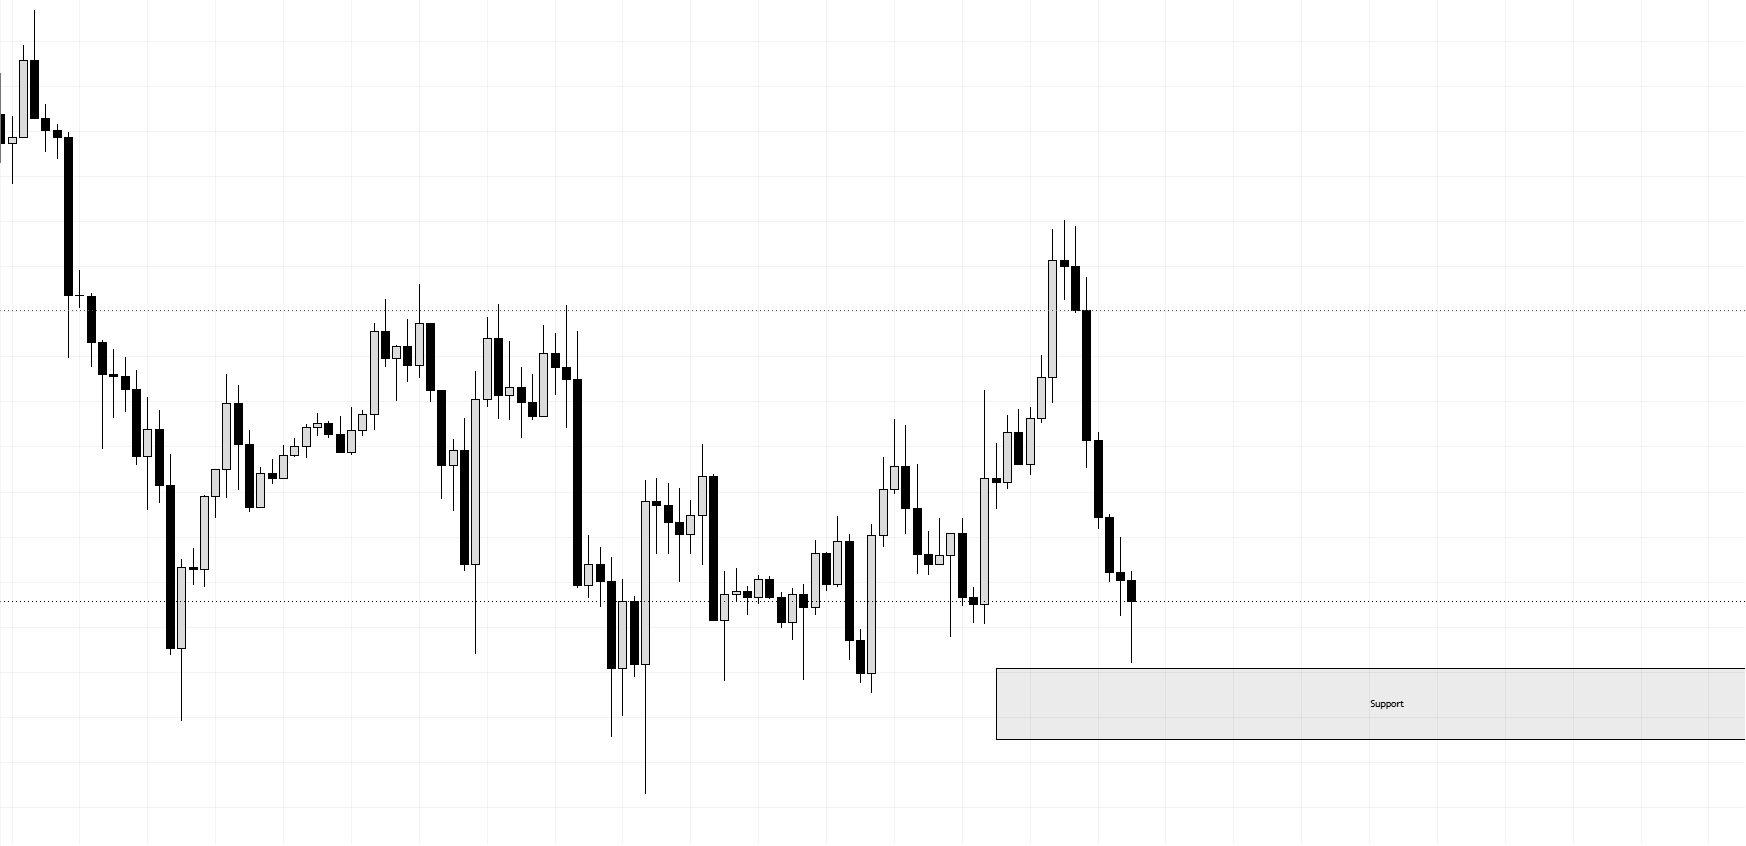
- Support and resistance: the places where price may bounce or stall.
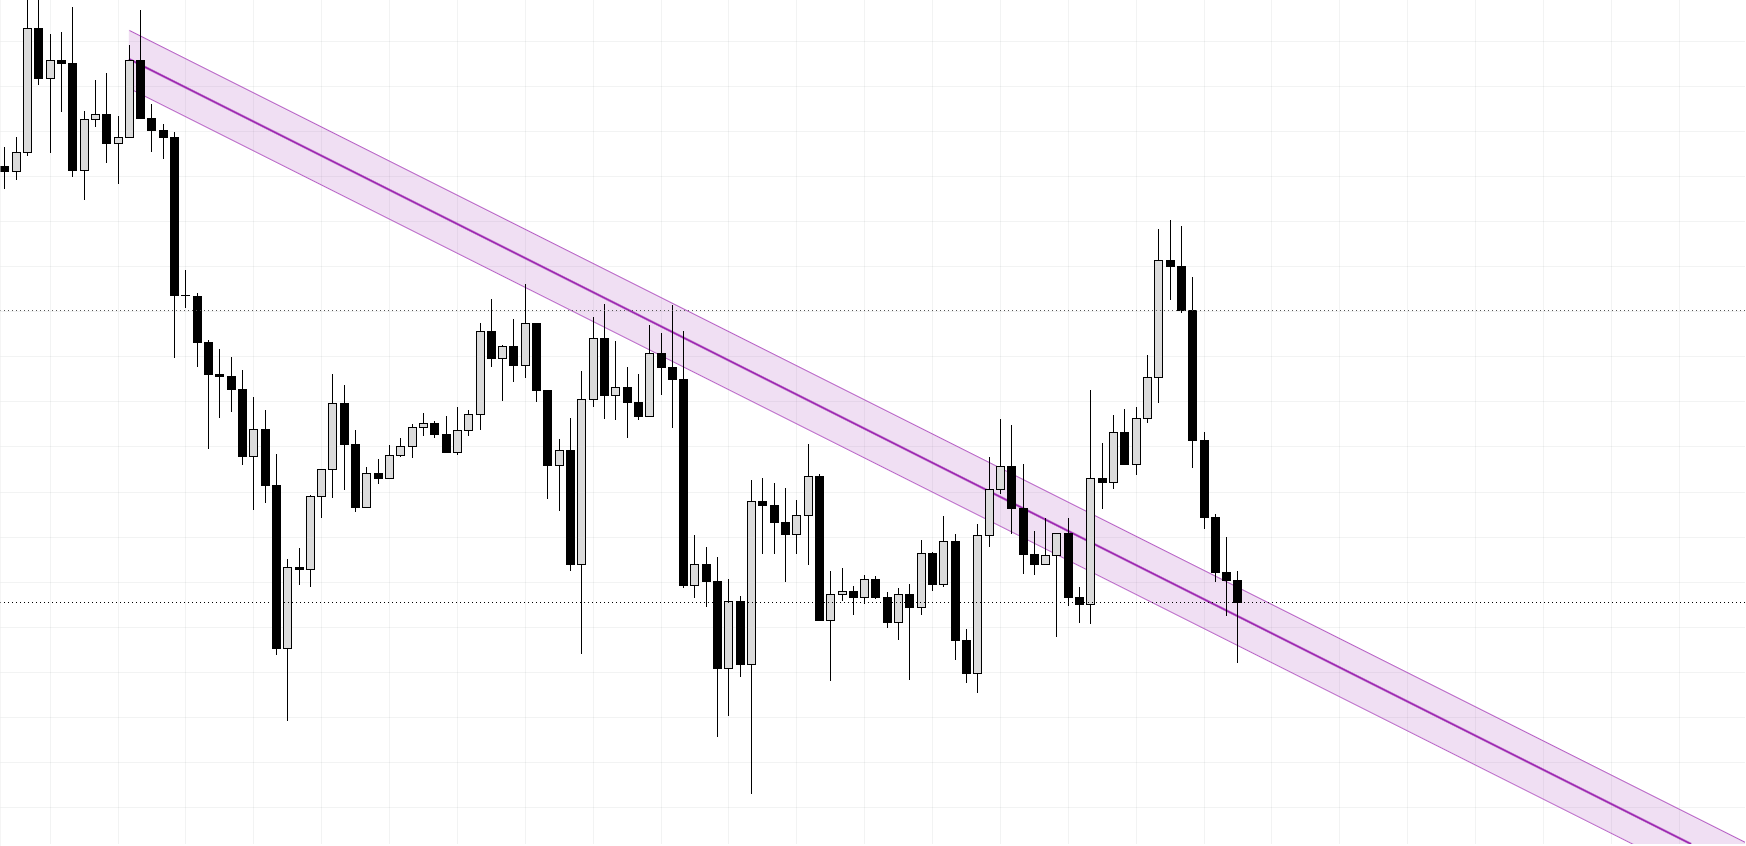
- The direction of the trend: is the market going up or down?
- The move in progress and the move to come.
- Potential reversals: the moments when the market may change direction.
Datas also spots the MSS and the MSB, with their targets: information just as essential.
They tell what the market is doing right now: is it reversing, or is it continuing? And how far it may go.
The MSS, the MSB and their targets
- MSS: the market changes direction. It’s a reversal signal.
- MSB: the market continues in its direction by breaking a new level.
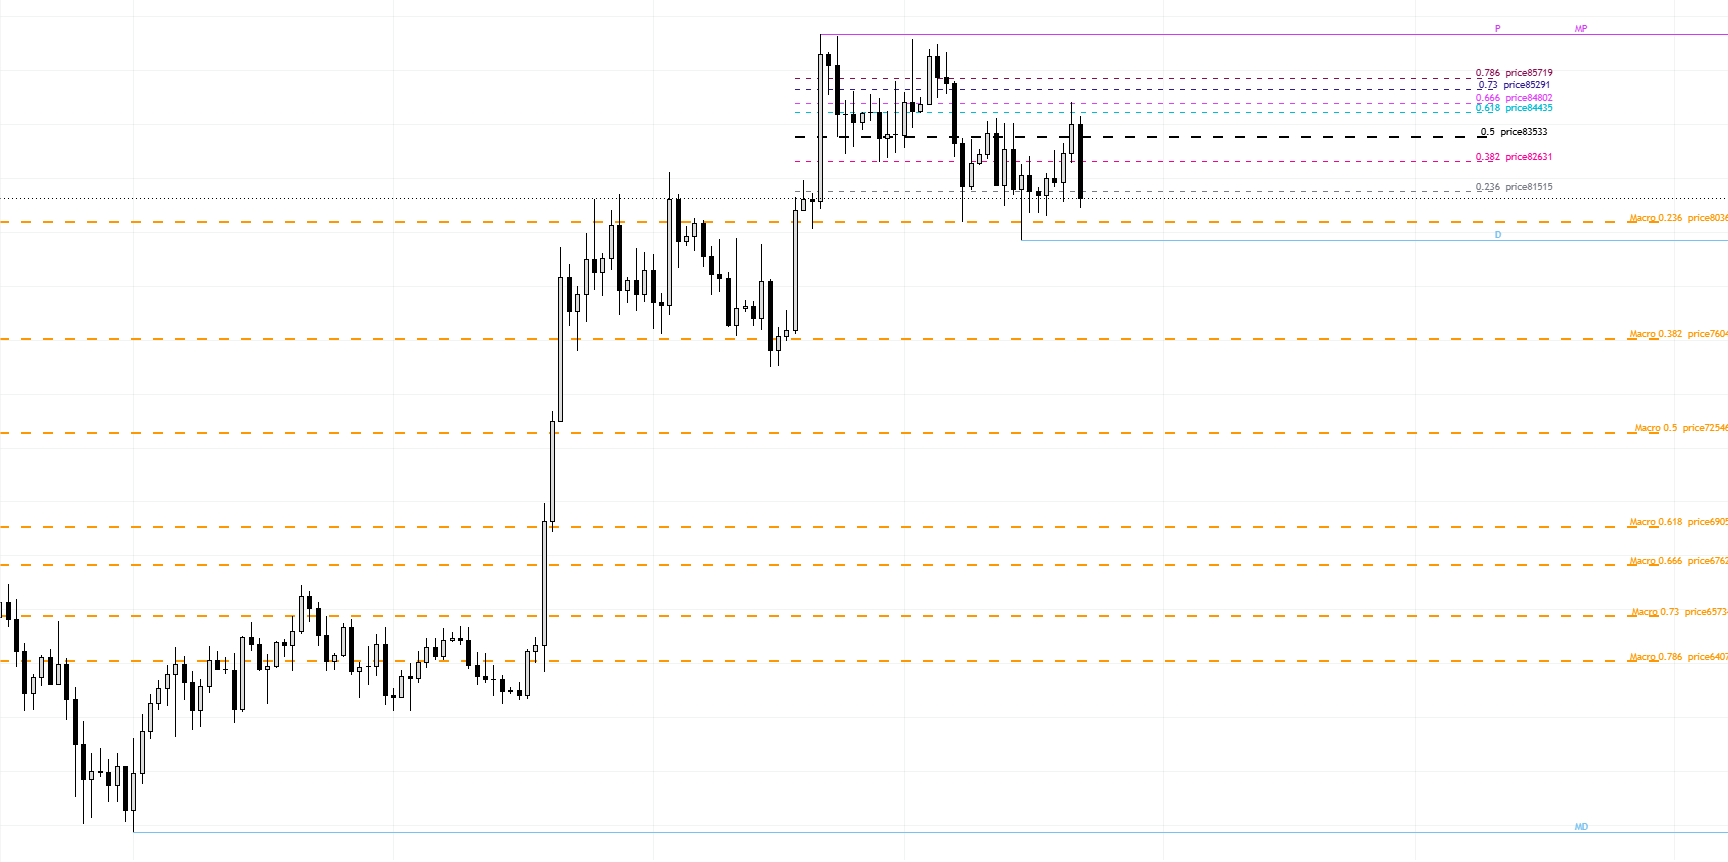
- Target: the price the move may aim for, drawn as a dotted line on the chart. Its exact price is passed on to the AI.
Datas also marks the key levels of the previous day, week and month, then passes all this information to the AI in one go.
For you: see at a glance where the market stands and what it’s preparing, without drawing anything yourself.