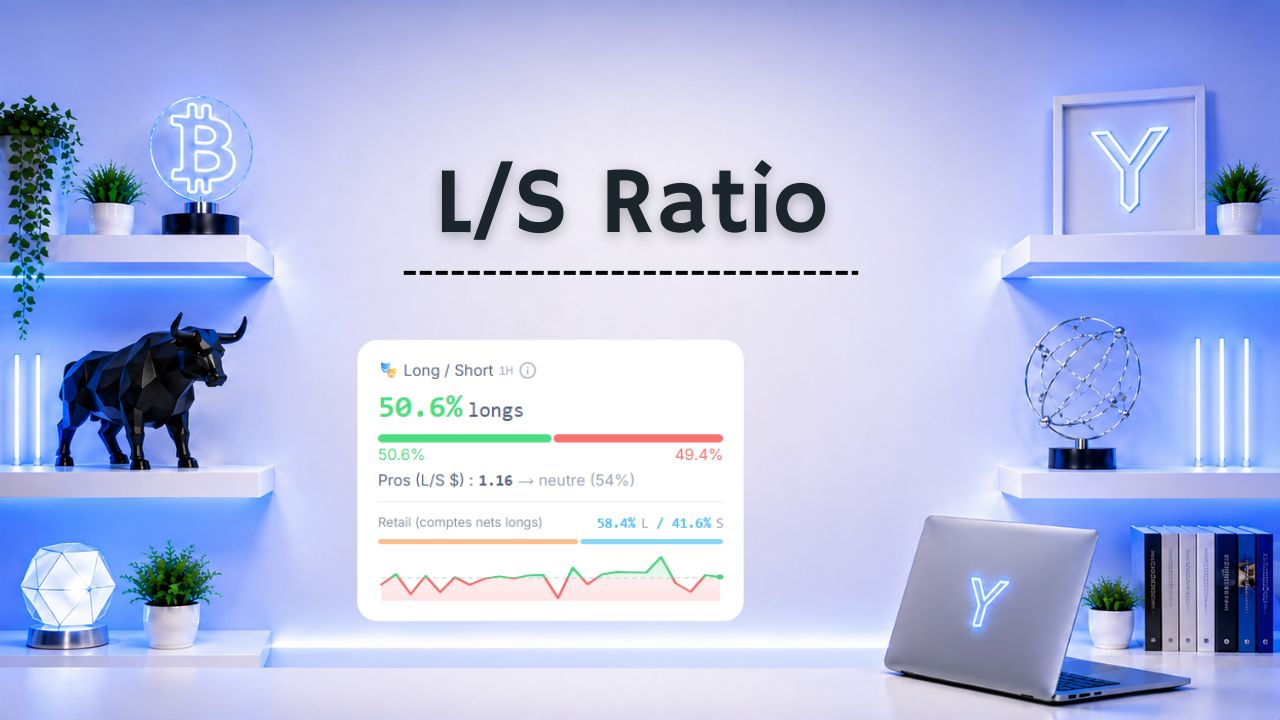
🎭 Long/Short Ratio – The market’s mirror
Imagine the market is a large theater. On one side, thousands of people are convinced the price will rise. On the other, thousands think exactly the opposite. The Long/Short Ratio acts like a mirror that shows which side the majority of traders is on. It does not measure market direction, but participant positioning.
🎯 What is it used for?
The Long/Short Ratio makes it possible to know whether traders are mostly buyers or sellers.
- 🟢 High ratio: a majority of traders is betting on a rise.
- 🔴 Low ratio: a majority of traders is betting on a decline.
Contrary to what one might think, following the majority is not always the best strategy. Markets often tend to surprise the largest number of people.
🧠 How should it be interpreted?
🟢 Many Long positions
When the Long/Short Ratio is very high:
- The majority of traders is optimistic.
- The market can continue to rise.
- But it also becomes more vulnerable to a correction.
🔴 Many Short positions
When the Long/Short Ratio is very low:
- The majority of traders is pessimistic.
- The market can continue to fall.
- But a violent rebound also becomes possible.
🔑 The divergences that matter
- Top Trader rises, Top Position falls → more accounts are buying, but less money is committed on the long side. Small positions may be entering while large ones take profits or hedge: the rise would be more fragile.
- Top Trader falls, Top Position rises → fewer accounts are buying, but more money. Large positions may be building up while smaller accounts leave or switch to selling.
- Top Trader rises, Top Position stable → more accounts are buying with no extra money. This could come from short positions closing or small buy entries, without conviction from the largest players.
- Top Position rises, Top Trader stable → long money is growing without more accounts. Large long positions may be building up, or large short positions closing.
- Top Trader or Top Position falls, the other stable → accounts or money are leaving the long side, while the other does not move. The largest players may hold their positions while the smaller ones leave, or profits may be taken on large positions.
- A wide level gap, for example Top Trader at 1.9 and Top Position at 1.3: the long side is carried by the number of accounts, not by money. The rise would come more from short positions closing than from real buying entries. In the other direction, a few large long positions carry the side, which makes it more fragile if they unwind.
⚠️ What you should never do
A high Long/Short Ratio does not automatically mean you should sell. A low Long/Short Ratio does not automatically mean you should buy. Above all, it is a sentiment indicator that shows where the crowd is.
🎭 Why does Ya.puka use the image of masks?
Because traders often display a collective emotion.
- 🎭 Everyone is smiling → optimism dominates.
- 🎭 Everyone is worried → pessimism dominates.
- 🎭 The more everyone thinks the same thing, the more the market may try to surprise.
The masks therefore represent the market’s general sentiment, and remind us that we must always keep a critical mind.
🤝 What should it be combined with?
🌋 Open Interest
Open Interest indicates whether new positions are being created. The Long/Short Ratio indicates in which direction these positions are mostly opened. Example:
- Open Interest rising sharply.
- Extremely bullish Long/Short Ratio.
➡️ Many new traders are buyers. The risk of a liquidation of Long positions increases.
📊 Funding Rate
Funding confirms whether one side is paying a premium to maintain its position.
- Very bullish Long/Short Ratio.
- Strongly positive Funding.
➡️ Buyers are very numerous and accept paying to stay exposed. Euphoria becomes significant.
💧 Money Flow
Money Flow shows whether new capital is truly feeding the move. A very bullish Long/Short Ratio accompanied by falling Money Flow can reveal a market carried more by optimism than by new investments.
💡 Ya.puka’s advice
The Long/Short Ratio is a sentiment indicator, not a direction indicator. It makes it possible to know where the majority of traders is, but the majority is not always right. By combining it with Money Flow, Open Interest, Funding and Liquidations, it becomes much easier to identify periods of euphoria, fear or potential market traps.