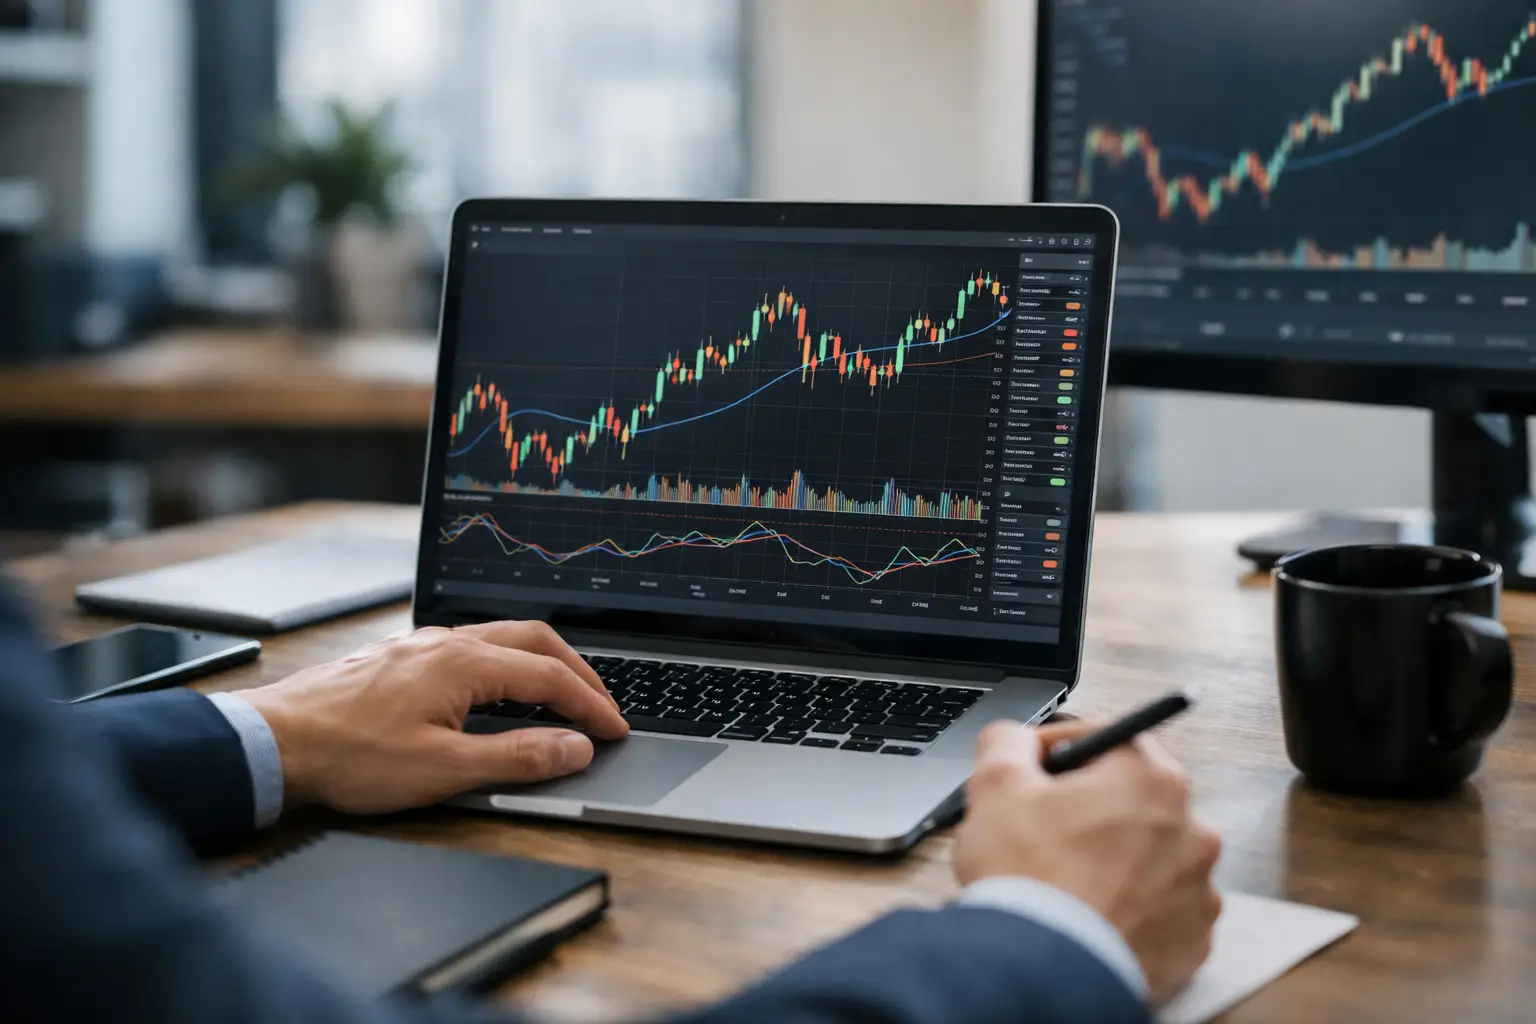
A Bitcoin chart accelerating, a stock nearing a previous high, an index changing pace: in the face of these moves, the question “what is TradingView used for” often comes up. The platform does not predict markets and does not replace a strategy. Above all, it provides a visual and technical framework to observe prices, compare assets, and organize an analysis before making a decision.
For both beginner investors and independent traders, its value is simple: moving from an impression—”this market seems to be rising”—to a reading based on levels, data, and predefined rules. This is useful, provided you understand what the tool actually shows and what it cannot guarantee.
What is TradingView used for in practice?
TradingView is a market analysis platform centered on charts. It allows you to track many assets: stocks, ETFs, indices, currencies, commodities, bonds, and cryptocurrencies. Depending on the exchanges and available data feeds, coverage may vary. Before any analysis, you should check that the price feed matches the asset you want to study.
Its main role is to represent the evolution of a price over time. You can view the same asset on a five-minute, one-hour, daily, or weekly timeframe. This choice radically changes the interpretation. A drop visible on an hourly chart may be just a minor move within an uptrend seen over several months.
The platform is also used to place technical indicators, draw support and resistance lines, receive alerts, and save watchlists. It then becomes an observation post. It does not automatically say “buy” or “sell” reliably, but it helps define the conditions that would make a decision consistent with your method.
Read the price before looking for indicators
The first use of TradingView is reading the chart. Japanese candlesticks generally display the opening price, the high, the low, and the closing price for a given period. A green or red candle is not a recommendation: it simply describes the balance of power expressed during that period.
By observing a series of highs and lows, you can identify a trend. Higher highs and higher lows suggest bullish momentum. Conversely, lower highs and lower lows indicate bearish pressure. In between, a price may move within a sideways zone, often called a range.
Horizontal lines are particularly useful for spotting levels where the market has already reacted. A support is an area where buyers have previously stepped in. A resistance is an area where supply has capped the rise. These markers are not unbreakable walls. They help prepare for several scenarios: bounce, confirmed breakout, or false signal.
This approach is often healthier than multiplying tools from the start. A chart loaded with ten indicators may give an impression of precision without improving decision quality. It’s better to be able to explain what you see in the price before adding a moving average or oscillator.
Use indicators methodically
TradingView offers a wide catalog of indicators. Moving averages help smooth the price and visualize a trend. The RSI can signal acceleration or exhaustion phases. The MACD aims to show momentum changes. Bollinger Bands provide a reading of relative volatility.
None of these tools works in isolation in every situation. A high RSI, for example, does not mean an asset must immediately fall. In a strong uptrend, it can stay high for a long time. The risk is turning an indicator into an automatic signal, without considering context, timeframe, or asset volatility.
A more rigorous approach is to assign a specific role to each indicator. A moving average can be used to filter the general trend. The RSI can help avoid entering after an already overstretched move. Volume can confirm or nuance a breakout. If two tools measure almost the same thing, stacking them does not necessarily strengthen the analysis.
For crypto investors, this nuance is essential. Digital markets are open continuously, sometimes illiquid on certain tokens, and sensitive to rapid moves. An indicator calculated on irregular data or on a thinly traded asset deserves more caution than an analysis on a large, liquid capitalization.
Create alerts instead of watching screens
One of TradingView’s most practical features is the alert system. You can be notified when a price reaches a level, when an indicator meets a condition, or when a line drawn on the chart is crossed. This avoids monitoring prices all day and reduces decisions made under pressure.
An alert is more useful when it matches a specific question. For example: “Is the price returning to my potential buy zone?” or “Is the weekly resistance being broken with significant movement?” At this point, the alert prompts you to reanalyze the context. It is not, by itself, an execution order.
You can also create separate watchlists: a list of French stocks, another of global ETFs, a third of major cryptocurrencies. This organization makes tracking clearer and limits the urge to jump from one asset to another with daily fluctuations.
Test an idea without confusing test and proof
TradingView offers simulation tools and, for advanced users, a programming language called Pine Script. These allow you to formalize rules: for example, buy when a short moving average crosses a long one, then exit if a risk threshold is reached. The historical results can then be reviewed.
This is an interesting approach, as it forces you to specify a method. However, a backtest is not proof of future performance. Results can be skewed by fees, slippage, data used, liquidity, or parameters too closely fitted to the past. A strategy that looks excellent over five years of history can fail as soon as the market regime changes.
You must also distinguish between the quality of a rule and the quality of its execution. A method may have solid logic but be hard to apply when it suffers several consecutive losses. Paper trading, or demo accounts, can help observe this gap without risking real capital. Again, emotions are weaker in simulation than with an exposed portfolio.
Limits to know before using it
TradingView is an excellent visualization tool, not a personal financial advisor. It knows neither your time horizon, your financial situation, nor your risk tolerance. A nice chart setup does not replace studying a company, its debt, results, valuation, or sector-specific risks.
The platform can also encourage overtrading if used without structure. Seeing signals everywhere, changing your plan after every candle, or following analyses published by other members can lead you to follow opinions rather than a process. Ideas shared in a community are starting points, not independent validations.
Finally, not all data is necessarily identical depending on the broker, exchange, or marketplace. A small difference in price, volume, or timing can change a short-term signal. For an important decision, check the price source and the exact execution conditions with your intermediary.
Put TradingView at the service of a clear process
The most relevant use of TradingView is not to find a miracle signal. It’s to build a routine: select a few assets, observe the trend across several timeframes, note key levels, define acceptable risk, then wait for your conditions to be met. This discipline is often more useful than chasing the next popular indicator.
An automated tool or AI agent can complement this work by monitoring several markets, synthesizing technical data, and flagging deviations from your criteria. It can save time, reduce mental load, and help spot information that deserves your attention. However, the decision, risk management, and context checks remain in your hands: AI helps you analyze more clearly, but never guarantees a profit.