
What is a Japanese candlestick?
A Japanese candlestick is a way to represent price movement over a given period. If you are on a 1-hour chart, each candle represents 1 hour. If you are on a 1-day chart, each candle represents a full day.
Each candle gives four pieces of information: the opening price, the closing price, the highest price reached and the lowest price reached during the period.
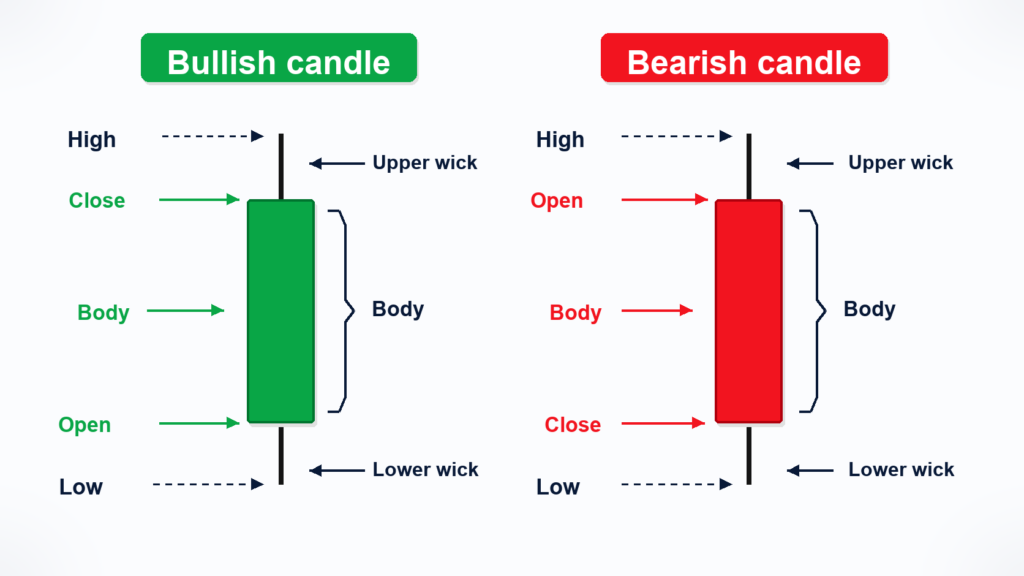
Bullish candle and bearish candle
A bullish candle means that price closed higher than it opened. It is often displayed in green, or light gray at Yapuka. This means that, during this period, buyers managed to push the price higher.
A bearish candle means that price closed lower than it opened. It is often displayed in red, or black at Yapuka. This means that, during this period, sellers dominated.
The body of the candle
The body is the distance between the open and the close. The larger the body, the stronger the movement was during the period.
A large green body shows strong buying pressure. A large red body shows strong selling pressure.
The wicks
The wicks show price excesses. An upper wick means that price moved higher, but did not manage to stay there. A lower wick means that price moved lower, but then bounced.
Wicks are very useful near support and resistance. They can show rejection, hesitation or a failed breakout attempt.
How to use this in practice
Never look at one candle alone at random. Always ask yourself where it appears. A rejection candle on an important support does not have the same value as the same candle in the middle of a range.
Reading candles becomes useful when combined with the technical zones we will cover in the next lessons. It is important to know the basic reading of these candles; we will cover it in the lesson: most used patterns.