Why use TradingView?
TradingView is a platform that lets you open charts, change timeframes, draw levels, add indicators and create alerts. It is one of the most widely used tools by traders because it is easy to learn and available directly in the browser.
If you have never opened a chart before, do not try to understand everything on the first day. Start with the basic actions: choose an asset, change timeframe, zoom, move the chart, add an indicator and draw a zone.
The recommended plan
To work comfortably with the Yapuka method, the plan we recommend is the Premium plan. At the time of writing, TradingView indicates that Premium notably allows up to 25 indicators per chart, 400 price alerts and 400 technical alerts. Most importantly, this plan offers alerts without expiration. This means you will not need to reprogram them every X days: the same alert can remain active and trigger as many times as needed, until you decide to disable it.
These limits matter because a complete analysis may require several tools: moving averages, Vegas, support and resistance zones, levels, alerts and possibly your own markers. You can get it here: TradingView Premium.
Why alerts change everything
A beginner often thinks they need to stay in front of the screen all day. That is not the goal. A good method is instead to prepare your zones, then let TradingView notify you when price reaches an important area.
For example, you can place an alert on a resistance, a support, a retracement zone or a level where you simply want to see what happens.
It is important to have alerts without expiration, because price can return to a zone, move away, then take several days or even several weeks before coming back again. Your alerts therefore remain active permanently, without you needing to recreate them. You still need to organize them: delete the ones that are no longer useful, rename them clearly and avoid keeping too many if you no longer know why they exist.
First simple setup
Start by opening a clean chart. Choose an asset you know, for example BTC, ETH, an index or a stock. At the top of the chart, choose the timeframe. Then add only the tools you need.
Do not overload the chart. An unreadable chart makes analysis harder. Your goal is to clearly see price, important zones and market reactions.
Step-by-step tutorial: finding your way around TradingView
When you open a TradingView chart for the first time, the interface may look busy. In reality, you will mostly use four areas: the asset search at the top left, the timeframes in the top bar, the indicators button in the top bar, and the drawing tools in the vertical bar on the left.
1. Choose the asset to analyze

To choose an asset, click the name or symbol displayed at the top left of the chart. You can then type the name of the asset, for example Bitcoin, Ethereum, Nasdaq, S&P 500, Apple, Tesla, or directly a ticker such as BTCUSDT, ETHUSDT, NASDAQ, SPX, AAPL or TSLA.
There may be several results for the same asset because an asset can be listed on several markets, brokers or exchanges. For example, Bitcoin can appear as spot, perpetual contract, against USDT, against USD, on Binance, Coinbase, Kraken or other platforms. To begin, choose a simple, liquid version that matches what you want to follow. If you analyze classic crypto Bitcoin, a pair like BTCUSDT on a major exchange is often easier to read than an exotic product with little volume.
The most important thing is to stay consistent. If you prepare your zones on BTCUSDT Binance, avoid changing source at every analysis without a reason, because wicks and some levels can vary slightly from one market to another.
2. Change the timeframe

The timeframe is in the top bar, often near the asset name. You will see values like 5m, 15m, 1h, 4h, 1D, 1W, 1M… Each candle then represents that duration. On 1h, one candle represents one hour. On 1D, one candle represents one day.
For a clean analysis, always start with a large timeframe. Look first at 1M, then 1W, then 1D and finally 4h to understand the general trend and major zones. Only after that, go down to 1h, 15m or 5m to look for more precision. Many beginners do the opposite: they start too low, see too much noise and get lost in small movements.
3. Add an indicator

To add an indicator, click the Indicators button in the top bar. A search window opens. You can type the name of the indicator you want to add, for example moving average, volume, RSI, Vegas, FVG, support and resistance, or the name of a script you have access to.
Add only a few indicators at first. A chart with too many tools may look more complete, but it often becomes harder to read. In this course, we recommend adding only the indicators available in our TradingView toolkit. They were designed to cover everything you need without spreading your attention everywhere, and they are also optimized for Yapuka analyses.
4. Use the drawing tools
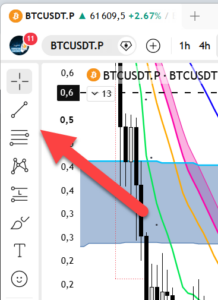
The drawing tools are in the vertical bar on the left side of the chart. This is where you will find trendlines, horizontal lines, rectangles, arrows, text tools, Fibonacci tools, and more. These tools are used to draw things on the chart.
A horizontal line can mark a support or resistance. A rectangle can surround an important zone. A trendline can help visualize a trend. A Fibonacci retracement can help identify a possible pullback zone. The goal is not to draw everywhere, but to make your analysis clearer.
5. Create an alert

To create an alert, you can use the alert icon in TradingView or right-click on an area of the chart, then choose the alert creation option. The idea is simple: you prepare your level in advance, and TradingView notifies you when price reaches the zone.
When you create an alert in TradingView, several options appear. For a beginner, the simplest approach is to keep a clean and easy-to-understand configuration.
Condition
This is what triggers the alert. For example: price crosses a level, moves above a resistance, drops below a support, or touches a line you have drawn. To begin, mainly use alerts on a price level or on a horizontal line.
Frequency
Choose whether the alert should trigger once or multiple times. To monitor an important zone, prefer an alert that can trigger every time the condition is met. This lets you be notified if price returns several times to the same zone.
Expiration
If your plan allows it, choose an alert without expiration. This is important because price can take several days or several weeks before returning to a zone. An alert without expiration stays active until you decide to stop it.
Alert name
Give it a simple and precise name. For example: BTC 4H resistance, ETH daily support, or Nasdaq zone to watch. If you receive a notification, you should immediately understand why it exists.
Message
Add a short note to remind yourself what to do when the alert triggers. For example: Check price reaction on resistance, do not enter automatically. An alert does not mean you should buy or sell. It simply tells you: “come look at the chart”.
Notifications
Activate the useful notifications: mobile app, pop-up or email depending on your preference. For a beginner, the mobile app is often the most practical, because it lets you be notified without staying in front of the screen.
Recommended simple setup: choose an important zone, create an alert on that zone, use repeatable frequency if available, select open expiration, name the alert clearly, then add a message that reminds you of the context.
6. Save your chart

Once your chart is prepared, get into the habit of saving it. On TradingView, saving is usually done with the cloud icon or from the chart layout menu. You can also enable autosave if your interface offers it. The goal is simple: keep your drawings, indicators, timeframes and markers so you can find them again later.
This matters because an analysis is built over time. If you draw your supports, resistances, alerts and important zones but do not save your chart, you risk losing your work or restarting your analysis at every session. By saving, you can come back to the same plan, see whether price respected your zones, correct your mistakes and progress much faster.
Also give your layout or chart a clear name, for example BTC swing 4H, ETH daily tracking or Nasdaq main analysis. The more organized your charts are, the easier it becomes to compare scenarios without mixing assets, timeframes or old ideas.
7. Simple routine for each chart
Before each analysis, always follow the same routine: choose the asset, look at the large timeframe, identify the general trend, mark the obvious supports and resistances, go down to a smaller timeframe, add only the necessary indicators, then place your alerts. This routine prevents you from clicking randomly everywhere.
Everything you will learn in this course can then be applied to any chart and any asset. The logic stays the same: read the context, identify important zones, wait for price to reach those zones, then observe the reaction.