
What is a range?
A range is a phase where price moves between two main zones: an upper zone that blocks the market, and a lower zone that supports it. Price does not show a clear trend. It moves sideways.
Ranges are very common. A market does not rise or fall all the time. It often spends a lot of time consolidating, accumulating or distributing before moving again in a clearer direction.
The longer a range lasts, the more important the move after its breakout can be. That does not mean the breakout will be easy to anticipate, but it explains why ranges must be taken seriously: they often prepare the next market move.
The upper zone of the range
The upper zone acts as resistance. It is the area where buyers struggle to push higher. Sellers can regain control there, or buyers can take profits.
Above this zone, there is often liquidity. Many traders place their stops above previous highs. The market can therefore come and take that liquidity before moving in the opposite direction.
The lower zone of the range
The lower zone acts as support. It is the area where price has already bounced. Buyers may defend the market there.
Below this zone, there is also liquidity. Many traders place their stops under previous lows. Price can therefore come and take that liquidity, create a wick, then move back into the range.
The middle of the range
The middle of the range is often the least interesting area. Price can move up or down without giving a clear edge. For a beginner, this is often where you need to learn to wait.
In the middle, the risk is getting trapped by moves with no real direction. Price can look like it is breaking out, then come straight back. That is why it is better to focus on the extremes of the range: the upper boundary, the lower boundary, and the price reaction on those zones.
Classic range and compression
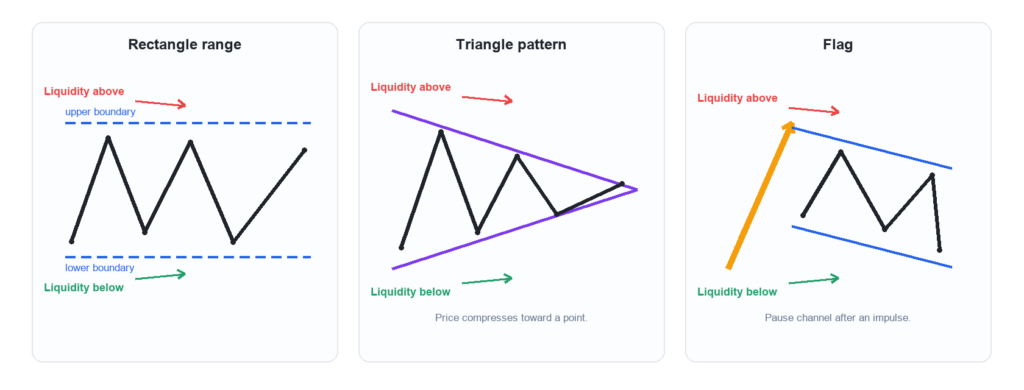
A classic range often looks like a rectangle. Price moves back and forth between an upper zone and a lower zone, like ping-pong between support and resistance.
But not all ranges are perfectly horizontal. Sometimes price contracts inside a tighter pattern, such as a triangle or a flag. In that case, the amplitude gradually decreases: the market compresses. We will come back to this near the end of the course in the lesson on chart patterns.
A compression can create a more impulsive breakout because price has been compressed for a while. Be careful, though: compression does not necessarily mean that a durable new trend is starting. It can simply produce a fast move toward a liquidity zone or a point of interest.
How to draw a range
To draw a range, look for the zones that touch the most price reactions. Sometimes the zone will use wicks. Sometimes it will use closes. The goal is not to draw a perfect line to the millimeter, but to identify the zone that best explains price behavior.
A range is built as price develops. At first, you may only have a hypothesis. Then, when new candles appear, you may need to adjust the boundaries. If your zone no longer touches the important reactions and cuts through the middle of the movement, it probably no longer explains the current structure.
You must therefore accept working with scenarios: is it a rectangle? A compression? A flag? Another pattern? Then let price confirm or invalidate the hypothesis.
Liquidity inside a range
In a range, liquidity often forms at both extremes: above the highs and below the lows. These zones attract price because they are where many stops and pending orders are placed.
When liquidity is taken on one side of the range, the market often looks for the other side afterwards. For example, price can first take the liquidity below the lower boundary, then move back toward the upper boundary. But this is not automatic: it is an indication, not a certainty.
What matters is the reaction after the liquidity grab. If price takes the liquidity and quickly re-enters the range, it can signal a trap. If, on the other hand, price breaks, accepts the broken zone and continues, the breakout becomes more credible.
Breakout and re-entry
When price exits the range, it can truly move in a new direction. But it can also make a false breakout, grab liquidity, then re-enter the range.
A breakout becomes more credible if the liquidity on the opposite boundary has already been taken and if price accepts the broken zone and continues in the breakout direction. A breakout followed by a quick return inside the range should make you cautious.
So do not rush in as soon as price moves beyond a boundary. The most important thing is to observe what happened before the breakout: was the liquidity on the opposite boundary taken? And what happens after the breakout: does price hold the zone? Does it retest cleanly? Does it show strength? Or does it re-enter the range directly?
Ranges inside ranges
A range can exist on every timeframe. A weekly range can contain several daily ranges, and a daily range can contain several 4h or 1h ranges.
The highest timeframe gives the main context. Smaller timeframes help you read the internal moves of the range. For example, a large range can show a long-term consolidation phase, while smaller timeframes show liquidity grabs and reactions inside it.
When you analyze a range, always start with the broader context, then zoom in gradually. This avoids giving too much importance to a small move that may only be noise inside a larger structure.
How to act as a beginner
For a beginner, the simplest approach is to avoid trading in the middle of the range. The market is often confusing there, and signals can contradict each other quickly.
The right approach is to mark the upper boundary and the lower boundary, then wait for price to reach an important zone. Then observe the reaction: rejection, wick, re-entry, clean breakout, retest or continuation.
If you trade inside a range, remember that it is a tricky area. The best reference points are the extremes, liquidity grabs and confirmations after a breakout. The goal is not to guess every move, but to understand what the range is telling you and wait for the market to give usable information.