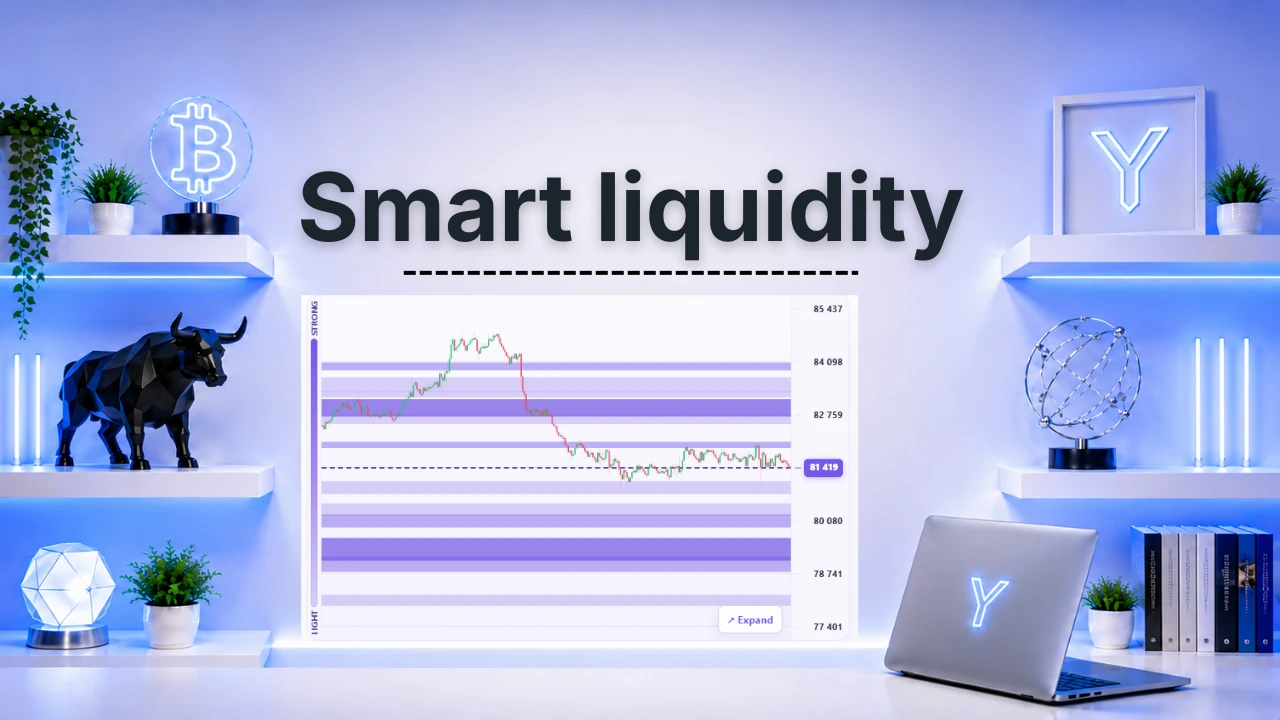
Smart Liquidity: where are the levels that matter?
Imagine a map of price where you had marked the places where a lot is going on: waiting orders, positions that could be closed by force, options. Smart Liquidity shows these levels around the price of Bitcoin, and tells you what price did in the past when it got there.
*The indicator is available in your language, like all Ya.puka indicators.
What is it used for?
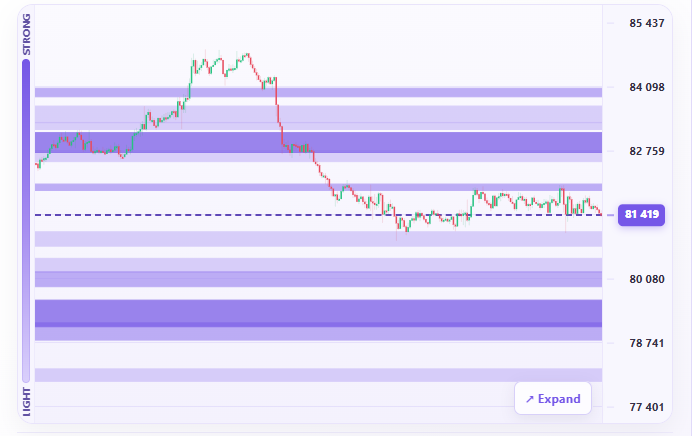
It helps spot the zones where price may slow down, rebound or accelerate. Each level is a purple band: the darker it is, the stronger the level compared with the others on the same side of price. It comes in three modes: Scalp, Day and Swing.
Where do the levels come from?
They come from three sources: the Binance order book (the visible buy and sell orders), the Hyperliquid liquidations (positions that would be force-closed at that price) and the Deribit options (which show where people are, not in which direction). A filter lets you display one source at a time.
How to read it?
The candles are the price, the dotted line is the current price and the purple bands are the levels. Hover over a band: a bubble gives the distance, the chance of getting there within 4 hours, what price did 1 hour after touching a level like this one, and the number of cases observed.
⚠️ What you should never do
No level announces what price will do. The percentages are frequencies observed over the last few days, not forecasts. Do not add up the amounts from the sources: they are not of the same nature.
What should it be combined with?
With price structure, the Vegas, liquidity zones, FVGs, the Sweet Spot, Open Interest and CVD.
💡 Ya.puka’s advice
First look at the number 1 level on each side of price, then observe how price reacts.