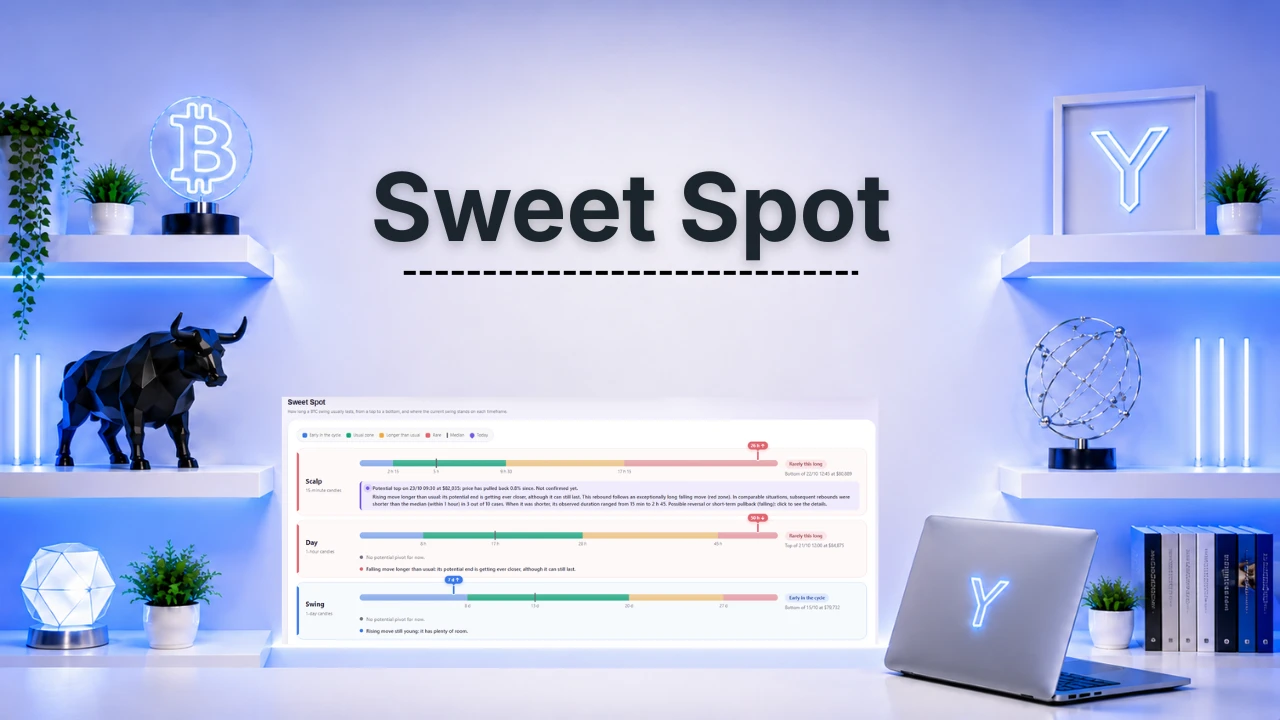
Sweet Spot: how long does a move last?
Imagine that every move of price is a wave. The Sweet Spot does not tell you where the next wave is going: it measures how long the current one has been going, and compares it to the usual duration of past waves.
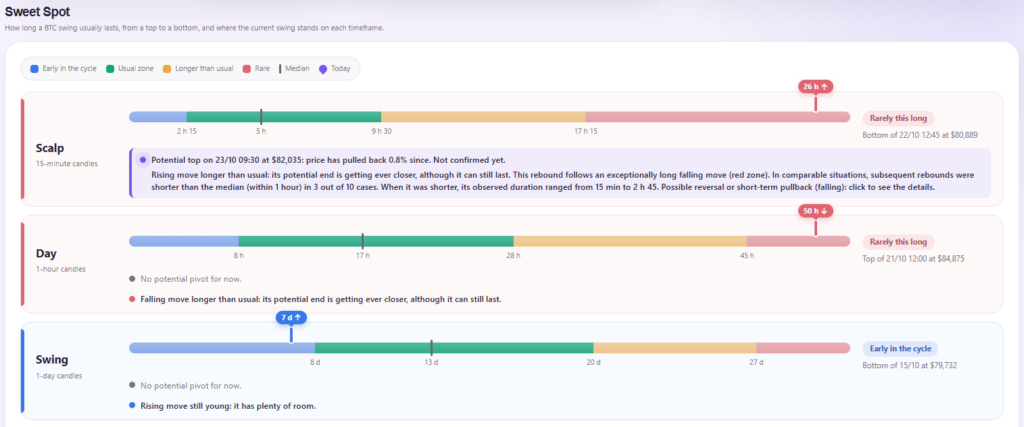
*The indicator is available in your language, like all Ya.puka indicators.
What is it used for?
It shows where the current move stands in its usual cycle: at the start, in the usual zone, longer than usual, or even rare. It does so on three scales: Scalp (15 minutes), Day (1 hour) and Swing (1 day).
How is it calculated?
It spots the tops and bottoms of BTC, measures the duration between each of them, then calculates the median and the usual zone from past moves. Each scale has its own durations.
How to interpret it?
The longer the move lasts, the further it advances in its cycle: start, usual zone, longer than usual, rare. When price moves far enough away from the last top or bottom, the indicator announces a “potential” pivot, not yet confirmed. It can disappear.
⚠️ What you should never do
Do not take it for a timer. A “mature” move does not mean price will reverse, and neither does a “rare” one. The Sweet Spot describes the speed of the market, it does not predict anything.
What should it be combined with?
With price structure, the Vegas, liquidity zones, FVGs, Funding, Open Interest and CVD.
It is particularly effective when combined with Top Trader and Top Position. These indicators complement each other: the Sweet Spot shows where the move stands in time, Top Trader and Top Position show what the largest accounts are building, and Open Interest confirms whether new positions are really opening.
For example, if price is at a support or a resistance (any important zone of interest), the move is mature in the Sweet Spot, Top Trader and Top Position point to a move being built, and Open Interest confirms it, then the timing could be very good.
💡 Ya.puka’s advice
Use it as a reference for rhythm, not as a signal.